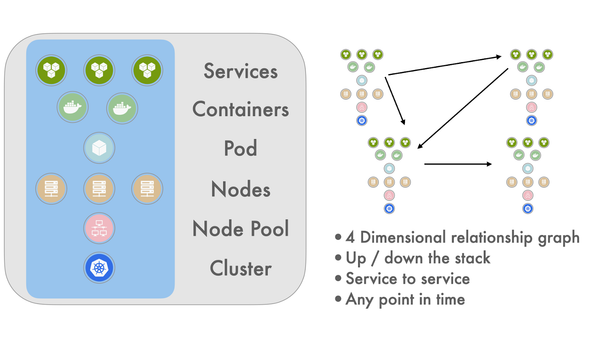
Asserts - Get to the root cause faster
  • Home
  • Docs
  • Blog
  • Company
Book a Demo Try sandbox
Why My P99 < Average

Why My P99 < Average

We use both average and quantiles to measure latencies, but monitoring tools often have limitations with percentiles, which sometimes produce counterintuitive results. While investigating a latency problem, we noticed that Prometheus -- the system we use for monitoring -- reported the P99 latency for our app was less than the

  • Jia Xu
Jia Xu May 20, 2022 • 3 min read
Golden Signals - Latency

Golden Signals - Latency

Observability of modern cloud-native applications should provide deep visibility into an application’s performance, call attention to problems brewing through high fidelity alerts and provide an intuitive troubleshooting experience that shouldn’t require expert domain knowledge. With the advent of open-source approaches either based on OpenTelemetry or the ubiquitous Prometheus

  • Nandakumar Devi
Nandakumar Devi Feb 24, 2022 • 5 min read
Observability Knowledge Graph

Observability Knowledge Graph

Compared to the old term “monitoring”, the new buzzword “observability” is not merely a marketing slogan. It does convey a new set of challenges with the cloud-native paradigm shift. This blog provides an engineer’s perspective on these challenges and why Asserts thinks Knowledge Graph has a lot of potential

  • Jia Xu
Jia Xu Feb 14, 2022 • 7 min read
Announcing Asserts

Announcing Asserts

We’re excited to announce Asserts -- a metric intelligence and observability platform. By taking your app's metrics to our Prometheus compatible time-series database (TSDB), Asserts intelligently discovers a real-time map of your app and infrastructure architecture, builds dashboards, tracks service level objectives (SLOs), and runs automated checks (Assertions) to

  • Manoj Acharya
Manoj Acharya Feb 8, 2022 • 8 min read
Monitoring Springboot Applications with Prometheus and Asserts

Monitoring Springboot Applications with Prometheus and Asserts

IntroductionSpringboot is a popular Java framework for building modern applications. With the help of the actuator module and the micrometer library, we can configure a Springboot application to expose performance metrics in the Prometheus format. Then we can set up a monitoring backend to consume these metrics. This blog provides

  • Jia Xu
Jia Xu Feb 1, 2022 • 6 min read
AWS Lambda Monitoring with Prometheus and Asserts

AWS Lambda Monitoring with Prometheus and Asserts

AWS LambdaAWS Lambda allows you to write functions and run them as a scalable service. It supports popular languages and runtimes like JavaScript/NodeJS, Python, Go and Java. It allows an event-driven model wherein Lambda functions are invoked in response to events, e.g., requests to an API Gateway, messages

  • Radhakrishnan J
Radhakrishnan J Jan 27, 2022 • 6 min read
The Benefits of Prometheus Counters

The Benefits of Prometheus Counters

IntroductionPrometheus has four metric types, among which the two basic ones are counter and gauge. A gauge is intuitive as it matches our expectation for a metric, i.e., it represents a numeric value that measures something like temperature, memory usage, etc. A counter that monotonically increases, on the other

  • Jia Xu
Jia Xu Jan 21, 2022 • 4 min read
Service Level Objectives and symptom-based alerting, part 2

Service Level Objectives and symptom-based alerting, part 2

In the previous post in this series, I explained why alerts should be based on the user-visible symptoms of problems rather than on problem causes. A quick recap: it is extremely hard to reliably alert on all the possible failure modes of a complex system, so a cause-based alerting strategy

  • Matt Cannizzaro
Matt Cannizzaro Oct 7, 2021 • 5 min read
Service Level Objectives and symptom-based alerting, part 1

Service Level Objectives and symptom-based alerting, part 1

If you follow application monitoring and the numerous monitoring tools vying for developer attention, you've probably noticed that everyone seems to be talking about service level objectives (or SLOs) all of a sudden. There are plenty of resources on the web defining what SLOs are – if you haven't seen them,

  • Matt Cannizzaro
Matt Cannizzaro Oct 7, 2021 • 4 min read

Sign up for our newsletter.

Get the latest articles delivered straight to your inbox.

Enter your email
Subscribe
Book a Demo
  • Home
  • Docs
  • Blog
  • Company
Copyright © 2020-2022 Asserts. All rights reserved.
  • Contact Us
  • Terms of Service
  • Privacy Policy