Monitoring RabbitMQ with Prometheus
RabbitMQ is the messaging heart of many applications. Learn how to monitor its vital signs with Prometheus.


RabbitMQ is an open source message broker written in Erlang built on the Open Telecom Platform. It supports various messaging protocols such as: AMQP, STOMP and MQTT. Client libraries are available for just about every programming language.
The combination of a powerful feature set, great performance and wide client support makes RabbitMQ the messaging heart of many applications. Such a crucial role means that keeping a close eye on its health is critical to ensuring applications meet their service level objectives.
Prometheus Metrics
RabbitMQ includes a plugin that exposes a rich set of metrics in Prometheus format. For an existing RabbitMQ servers running on a host they can be enabled by:
$ rabbitmq-plugins enable rabbitmq_prometheusFor containerised deployments, the plugin can be enabled in the Dockerfile:
FROM rabbitmq:3.12
RUN rabbitmq-plugins enable rabbitmq_prometheus
Alternatively a configuration file can be used with an Erlang list of the plugins to enable:
[rabbitmq_prometheus, rabbitmq_management]This file is then mounted at run time:
$ docker run -v ./enabled_plugins:/etc/rabbitmq/enabled_plugins \
    rabbitmq:3.12
By default the metrics are exposed on port 15692 under the /metrics endpoint. To have Prometheus scrape the metrics the scrape configuration should be updated or if using the Prometheus Operator, a Service Monitor added.
What To Watch
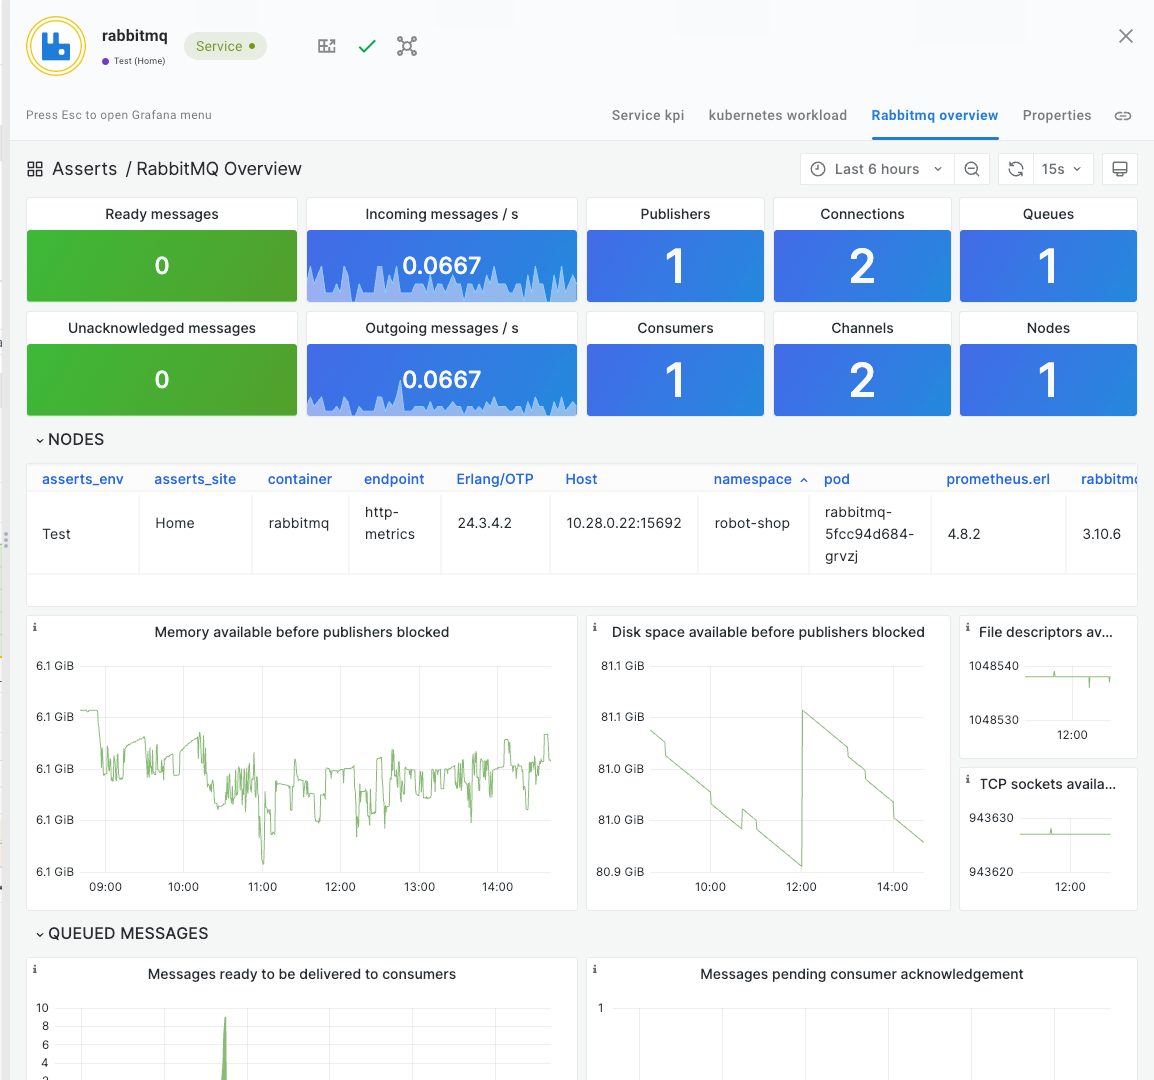
A lot will depend on the type of workload RabbitMQ is handling. However, there are some key metrics to keep an eye on.
- Unacknowledged messages
- Memory available
- Disk space available
- File descriptors available
- TCP sockets available
- Un-routed messages dropped / returned
- High queue creation / channels opened / connections
- Application specific queue depths
RabbitMQ does provide some example dashboards to get you started. These can be imported into Grafana and Prometheus alert rules created.
Unacknowledged messages - When a message is received the client should acknowledge this; this may be achieved automatically or explicitly. If messages are being consumed but not acknowledged, it is an indicator of possible problems with message delivery.
Resources - RabbitMQ needs resources to process messages, a shortage of resources will lead to publishers being blocked and messages not accepted.
Un-routed messages - Failure to successfully route messages to their destination will lead to them being returned or even dropped. This is typically due to some misconfiguration and should be rectified immediately.
High churn - The number of queues, channels and connections should be reasonably steady. High churn on these resources is an indicator of potential problems with the producers and/or consumers.
Queue depths - Messages should typically be processed promptly once they have been placed on a queue. However, the queue mechanism does allow for messages to be temporarily published faster than they can be consumed. Generally if a queue depth is too large, it is an indicator of possible latency issues in the consumer.
By default RabbitMQ only exposes aggregated metrics across all queues. It is possible to enable reporting of individual queue metrics on the /metrics endpoint but this is not advisable because it has the potential of a cardinality explosion. A separate metric endpoint /metrics/per-object is provided which can be used with a relabel configuration to only collect metrics for specific queues, therefore avoiding high cardinality.
apiVersion: monitoring.coreos.com/v1
kind: ServiceMonitor
metadata:
  name: queue-metrics
spec:
  selector:
    matchLabels:
      app: rabbitmq
  endpoints:
    - port: http-metrics
      path: /metrics/per-object
      metricRelabelings:
        - action: keep
          regex: "(orders|payments)"
          sourceLabels: ["queue"]
The total queue depth is rabbitmq_queue_messages_ready{queue="orders"} + rabbitmq_queue_messages_unacked{queue="orders"}
Automate With Asserts
Instead of spending valuable time and effort setting up all the dashboards and alert rules, add Asserts on top of your existing Prometheus. Asserts includes a curated library of dashboards and alert rules enabling engineers to be productive immediately.
Asserts also includes anomaly detection based on automatically generated multiple period baselines.
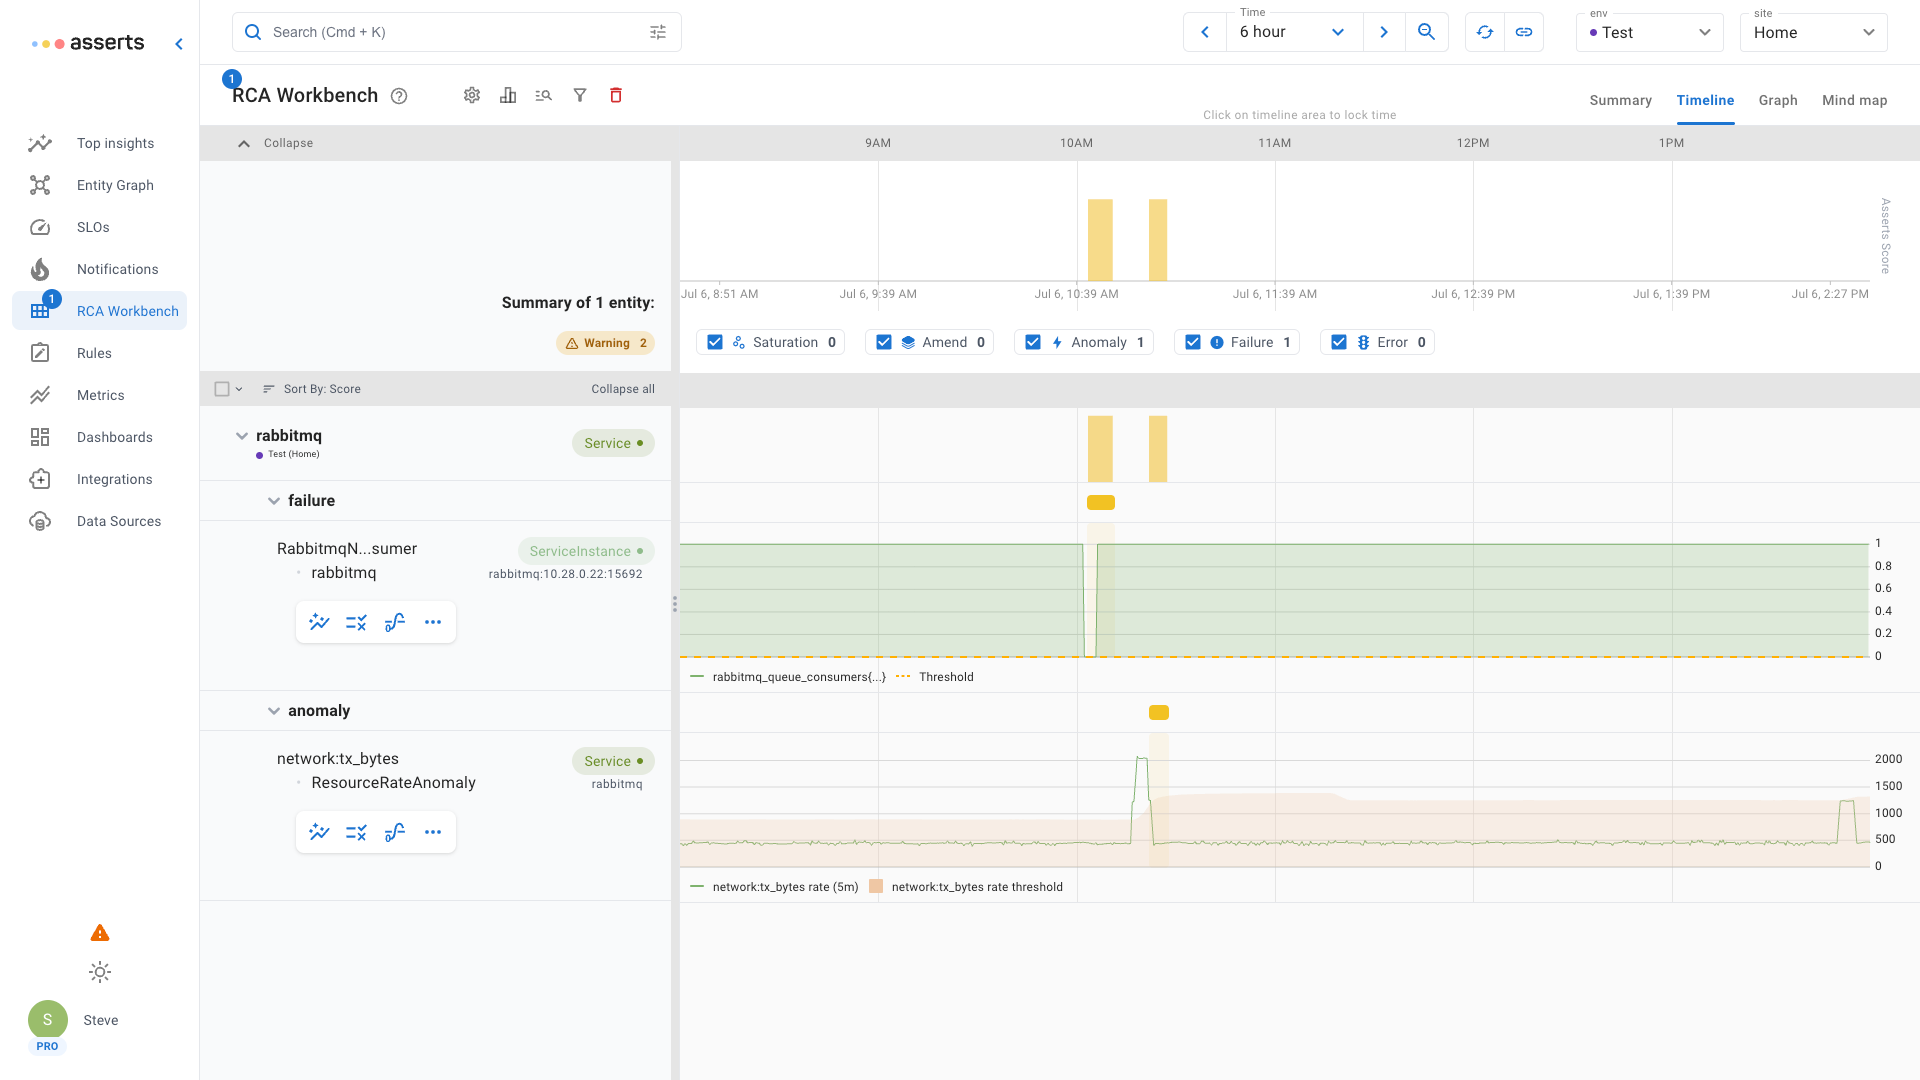
The RCA Workbench shows a failure when the consumer disconnected followed by a later network traffic anomaly when it reconnected and drained the queue.
Install Asserts today for free, forever to save the considerable toil of creating and maintaining dashboards and alert rules. Gain automatic anomaly detection and operation intelligence via the Entity Graph.