Avoiding The 20 Dashboard Tabs Problem
"My mind is like my browser. It has too many tabs open, some of them are frozen and I don't know where the music is coming from" - Exhausted SRE trying to resolve an incident.


Manual correlation is hard and time consuming. Engineers open multiple browser tabs for dashboards from different tools across various application components and craft ad-hoc queries in various obtuse syntaxes. All in a futile attempt to build a mental picture of the interconnectedness of the application components relevant to the incident. It is a Herculean task to keep up with the pace of change coming through the CI/CD pipeline and the ever increasing complexity of modern distributed applications.

Distributed tracing is supposed to be of assistance here but alas it just compounds the problem. Tracing only illuminates the connections between services, it does not provide the dependencies down through the stack that the services rely on. Tracing is expensive, it is essentially structured logging at DEBUG level, with each span typically being 2kB and each trace having a dozen spans, the size of the trace data soon becomes a significant storage burden. In an attempt to control the unbounded expansion of captured trace data, sampling is used; typically head based sampling using a fixed percentage e.g. 10%. This is where Murphy's Law comes in to play, it clearly states that the traces you need are the ones that were not sampled.
Intelligent Sampling
Metrics are much more efficient in their storage requirements, a Prometheus metric only requires 1.3 bytes per sample. Asserts generates metrics from trace spans, which are then used to calculate multiple period baselines for each endpoint of the traced services. The baselines enable intelligent sampling by knowing if a call to an endpoint is slower than normal. Using this decision criteria along with checking the HTTP status code and/or the span error flag, allows Asserts to just collect the problematic traces and discard the rest. The resulting sampling rate can be as low as 1%, with minimal risk of missing important diagnostic information.
Living Entity Graph
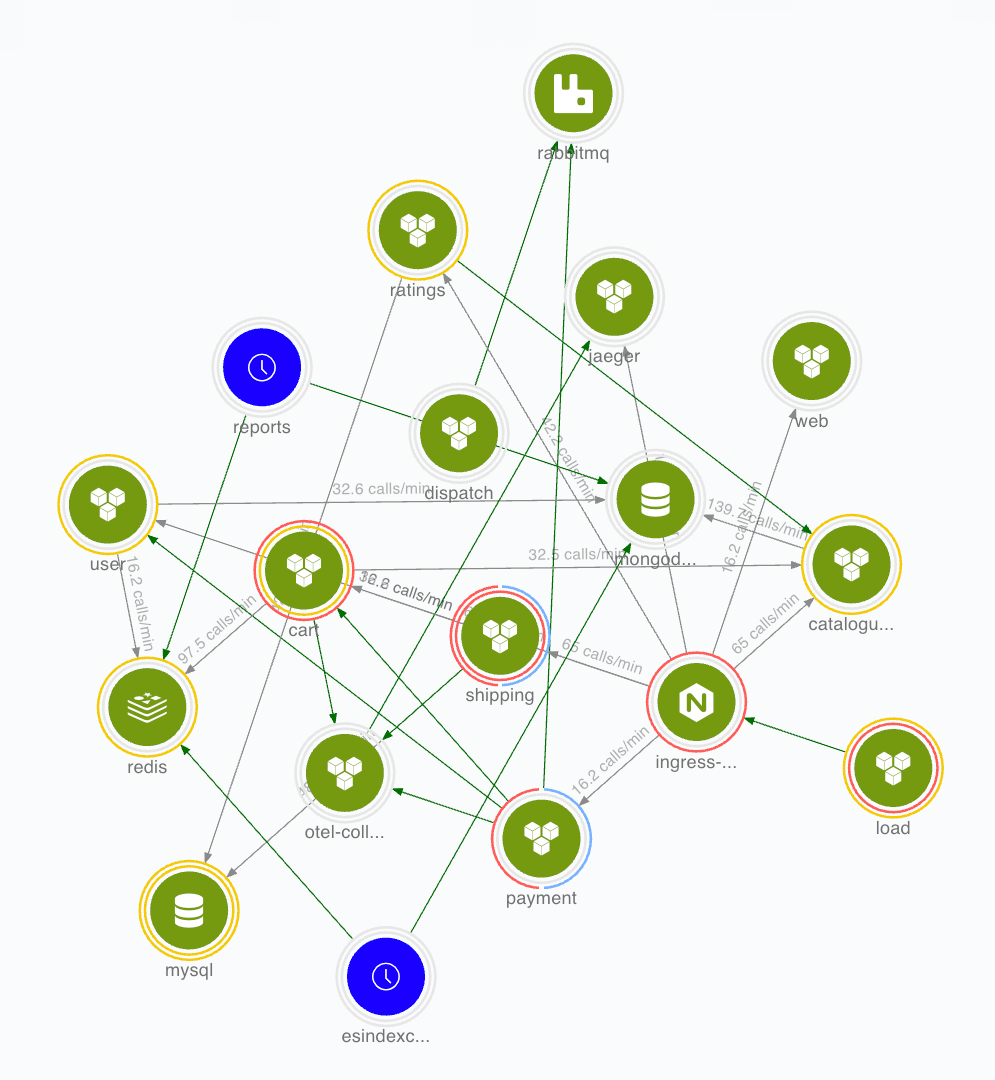
Span tags and metric labels from across all application components are analysed to create a living topology map of all application components. Asserts knows what was talking to what and the stack it was running on at any point in time. When an incident occurs, the topology map is traversed to collate all relevant application components onto one dynamic metric dashboard with contextual access to logs and traces. Everything an engineer needs to resolve an incident on one dashboard.
Join our webinar on 8th August 2023 at 10:00 a.m. (PDT) to find out how to close down those 20 open browser tabs and streamline incident resolution.