An Introduction to Prometheus
Over the years it has become the de facto standard for time series metrics across the CNCF Landscape, with many projects providing a Prometheus metrics endpoint as standard.


Prometheus was developed by SoundCloud starting in 2012, as a result of their existing metrics solution not meeting their needs. Prometheus was built to include: a multidimensional data model, operational simplicity, scalable data collection, and powerful query language all in one. It was accepted by the CNCF in 2016 and graduated in 2018.
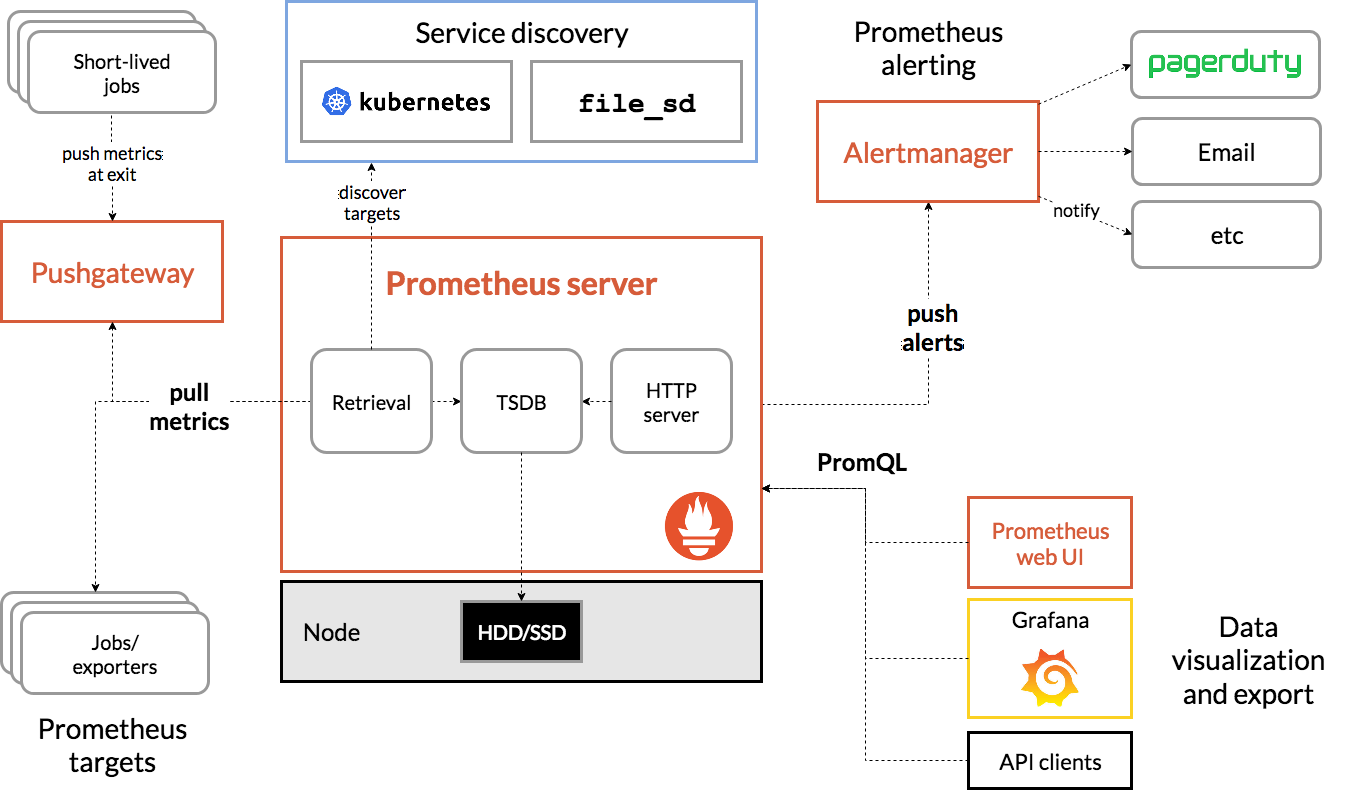
Over the years it has become the de facto standard for time series metrics across the CNCF Landscape, with many projects providing a Prometheus metrics endpoint as standard. Prometheus works by pulling or scraping metrics from targets, rather than targets pushing metrics to it.
Ecosystem
As well as many projects in the CNCF Landscape providing a Prometheus metrics endpoint by default, there are numerous other projects which seek to enhance and extend the capabilities of Prometheus. This section is not an exhaustive list.
Alertmanager
Alertmanager is a part of Prometheus, it’s a separate process that receives alert notifications from Prometheus and then deduplicates, groups, and routes to notification systems such as SMTP, PagerDuty, Slack, etc. Asserts sends alert notifications via Alertmanager, seamlessly integrating into your existing configuration.
Alert rules are configured as part of the Prometheus configuration. Rules are written in PromQL inside the configuration YAML file. Asserts provides a curated library of rules that covers 99% of use cases, saving your DevOps team a considerable amount of toil. The library can be tweaked to local requirements.
Language Client Libraries
For Prometheus to be able to scrape metrics from your application services, they must expose a metrics endpoint. Fortunately, there are Prometheus client libraries (agents) available for just about every programming language. Manually injecting metric collectors into every endpoint of all your services would be rather burdensome. However, there are also middleware libraries for many frameworks e.g. NodeJS Express, Python Flask, Go Gorilla, Java Springboot, etc. These libraries provide metrics for the service endpoints and the language runtime, significantly reducing the effort required to instrument your services for metric collection. This is similar to what is required for commercial products such as Datadog and New Relic, however, Prometheus is an open standard and avoids vendor lock in.
Exporters
While many CNCF Landscape projects provide a Prometheus metrics endpoint, there are many software components that do not. This is where exporters come into play. An exporter extracts pertinent metrics from the piece of software in question and exposes them on a Prometheus metrics endpoint. In Kubernetes, the exporter is typically run as a sidecar. There are too many exporters to list, the common ones are:
- Node - OS metrics
- Kube State - Kubernetes entities
- Blackbox - Swiss Army knife HTTP(S), DNS, TCP, ICMP
- Redis, MySQL, Postgres, Kafka, MongoDB, ElasticSearch, etc.
Push Gateway
Prometheus collects metrics via pull or scrape operation. This works well for long running services but short lived jobs may fire up, do their work and exit in between scrapes. This is the main use case for the push gateway, the short lived job pushes its metrics to the gateway, which caches them to be scraped later.
Grafana
One can not mention Prometheus without mentioning Grafana. Just as Prometheus has become the de facto standard metrics engine, Grafana has become the de facto standard dashboard tool.
Asserts embeds the Grafana engine and provides a curated set of dashboards freeing your DevOps team from the toil of creating and maintaining dashboards. If you already have some favourite dashboards you want to keep, you can easily import them into Asserts.
Thanos & Cortex
While Prometheus has many virtues it does have a few limitations. It’s a single process that scales vertically; fortunately, it’s quite efficient. It was never designed for long-term storage of metrics, the default storage period is just 15 days; great for troubleshooting, but not so good for historical reporting. These projects address both of these shortcomings providing a highly available cluster and practically unlimited historical storage via AWS S3 or similar service.
Victoria Metrics
Victoria Metrics provides similar capabilities to Thanos and Cortex when used with Prometheus. However, it can also be used instead of it, with their vmagent providing the metrics scraping functionality.
Asserts uses PromQL, the query language for Prometheus, to record metadata, aggregates, anomaly bands, alerts et al., and stores in its internal Graph and TimeSeries DB.
Running Prometheus
When it comes to running Prometheus for your time series metrics engine you have two choices, running it yourself or using Prometheus as a service provider.
On Your Own Servers
If you choose to run it on your own kit, be it physical or virtual, the first consideration is how much compute resource you’re going to need. A single Prometheus instance is good for approximately 10 million metrics, each metric uses 5 - 8kB of memory. Prometheus uses Linux page buffering for disk data so double the memory requirement for each metric. The big question is how many metrics will you have. For example, a small demo Kubernetes cluster with 3 nodes, Robot Shop sample application, and Asserts installed produces 60k metrics resulting in the Prometheus Pod using 500MB of memory, 0.3 CPU, and 1.7GB of storage.
Compute resources are only one part of the cost equation, consideration should be given to the amount of man-hours required to set up and maintain your Prometheus instances. When running Prometheus inside a Kubernetes cluster, the setup and maintenance effort is minimal, outside of Kubernetes there’s extra work to be done. When installing Prometheus on Kubernetes it is highly recommended to use Helm to install either Prometheus Operator or Prometheus Community Kube Stack. Both of these Helm charts do the heavy configuration work for you leaving just minor tweaking of settings to suit your environment.
For Kubernetes, a typical deployment architecture consists of one Prometheus instance in every cluster with remote write to an aggregation and long term storage solution such as Thanos, Cortex, or Victor Metrics. If a Prometheus instance should fail, Kubernetes will restart it. There may be a small gap in the metrics while the restart happens. If this is unacceptable then two Prometheus instances can be run as a highly available pair across multiple nodes in the cluster. Each Prometheus instance scrapes the same targets therefore no collection is missed if one instance goes down. It’s a similar story for the aggregation and storage solutions, they can be run on a Kubernetes cluster with multiple replicas of each component. Long term storage is typically provided by AWS S3 or a similar service.
Prometheus as a Service
There are a number of providers for Prometheus as a service, the big cloud vendors AWS, GCP, and Azure (Preview) offer this service. There are also a number of other smaller providers including Grafana Mimir, Logz, Logit, Aiven, OpsVerse.
Using Prometheus as a service frees you from the complexities of setting up and maintaining an aggregation and storage platform but you’ll still need to run Prometheus instances alongside your application services. Remember Prometheus pulls metrics from exposed endpoints so you need local instances to do the scraping and then configure remote write to the service provider. Prometheus can be run in agent mode which optimises it for remote write, disabling querying, alerting, and local storage. Alternatively, Victoria Metrics vmagent does the same thing, more of which are below.
Of course, you’ll have to pay for this service with charges for metric ingestion, storage, and queries. It’s fairly easy to estimate how many metrics and how much storage they’ll use, estimating query usage is a bit more tricky as there are many variables. Each Grafana dashboard will issue a number of queries each time it’s refreshed. Each Grafana user will visit a number of dashboards. Alert rules will issue one or more queries for each periodic rule evaluation per metric set. For example, if you have 100 monitored nodes and you have a CPU utilisation rule evaluated every minute, that’s 4.4 million queries per month.
Again Victoria Metrics has a different spin on providing Prometheus as a service. They have a more simple pricing model based on the amount of compute (CPU & memory) and storage used. This is arguably more predictable and easier to estimate, it can also work out less expensive than the other pricing models. As an added bonus they have the vmagent which can be deployed in place of a local Prometheus instance to scrape and forward metrics. The use of their agent will save you some local storage costs too.
Prometheus + Asserts

Asserts can connect to your Prometheus running in your K8s cluster or any of the Long term Prometheus as a Service and instantly provide:
- Service Level Objectives
- Analytic insights
- Entity Graph
- Root cause analysis workbench
- A curated library of alert rules and dashboard visualisations
Discover Asserts
Whether you’re just planning your first Prometheus install or you’ve already deployed Prometheus across all your clusters, Asserts turns your Prometheus metrics into actionable SLO driven information with minimal effort from your DevOps teams. Take a peek at our tour, try it out in our sandbox environment or sign up for a free trial to test it out with your own data.