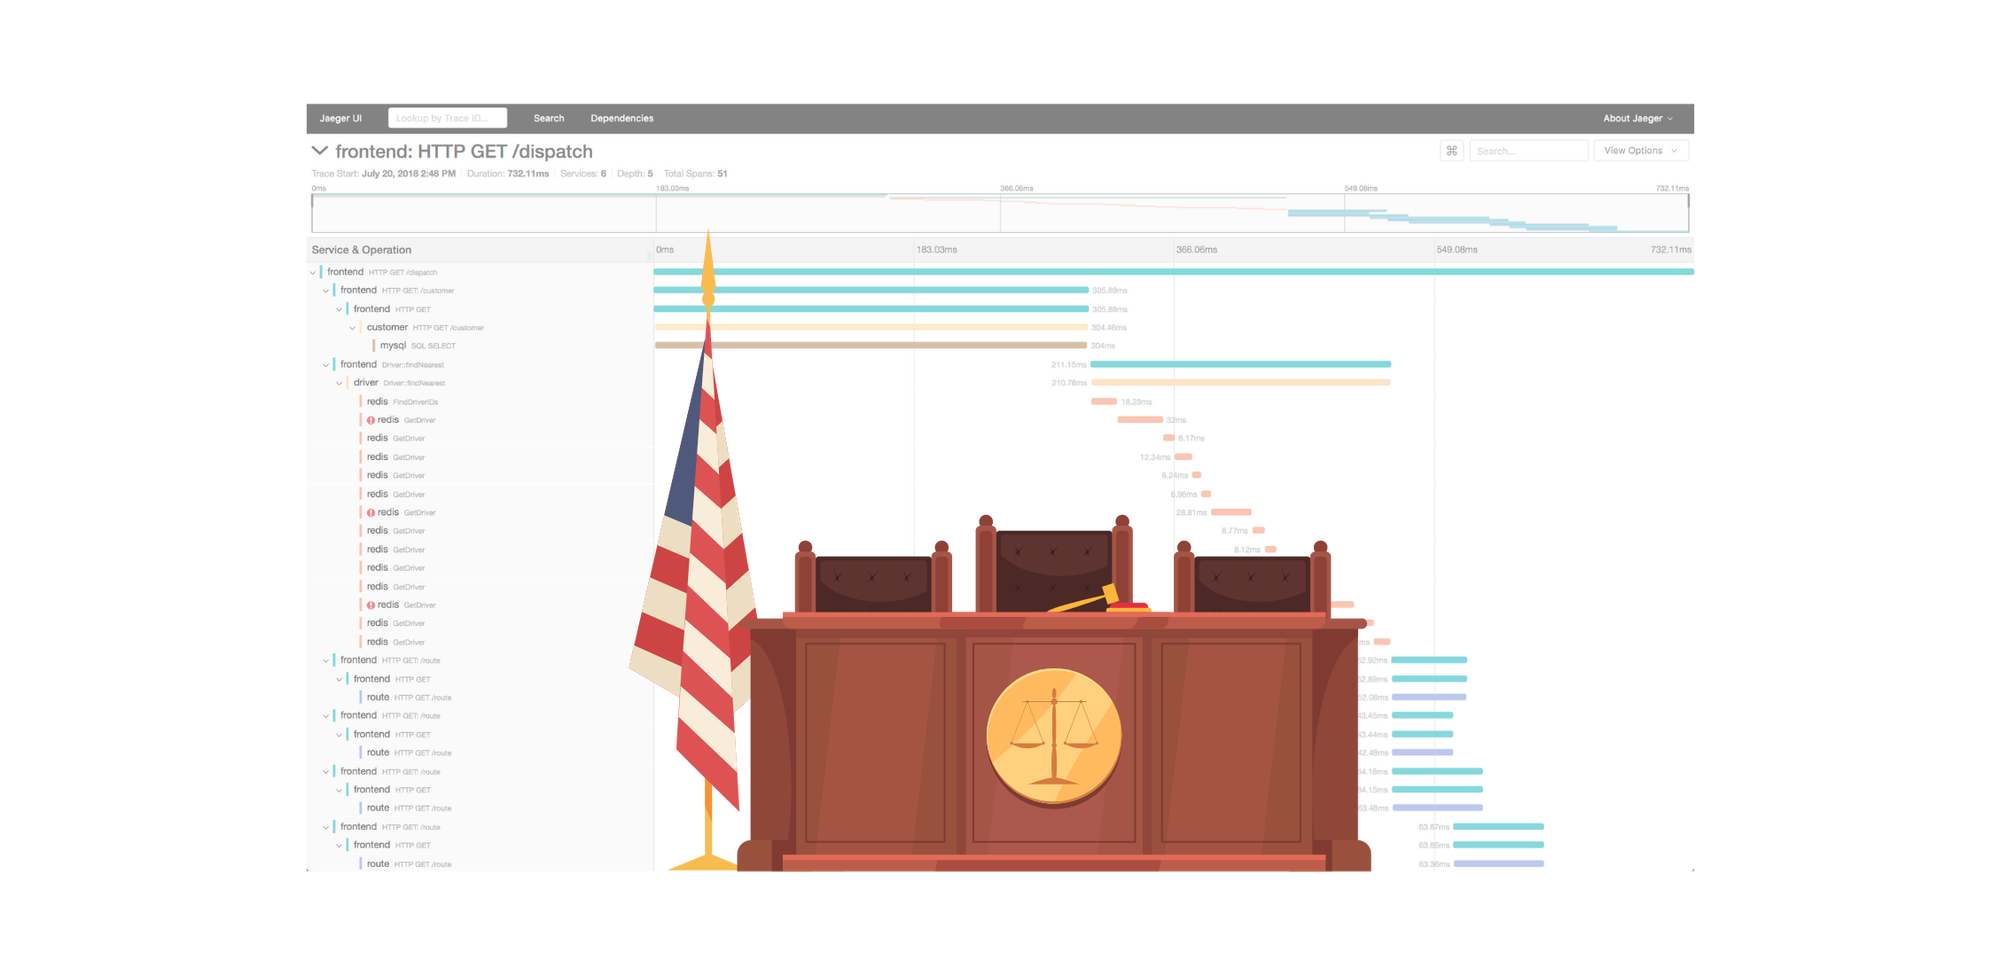
Tracing is on Trial
Tracing is just structured logging at DEBUG level. Would you run logging at DEBUG in production? No!

The Defense
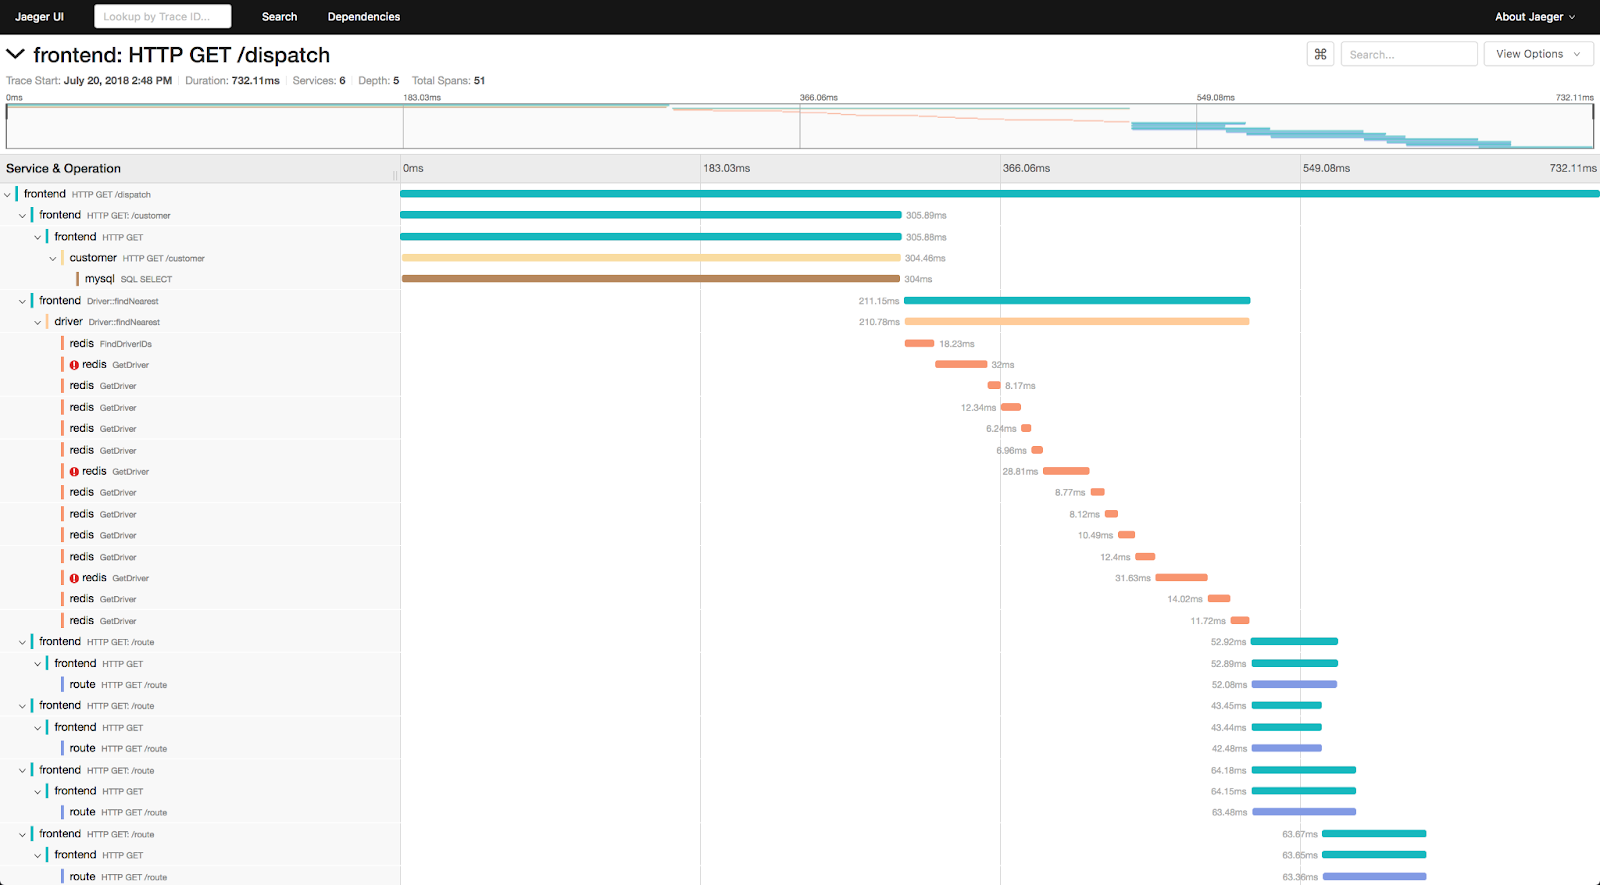
The triumvirate of Observability is Metrics, Logs, and Traces. Metrics provide time series data points for infrastructure resource utilisation. Log aggregation provides a central place to query system and application service logs. The tracing of requests has become more important with the rise of microservice architectures, where a single request may take a torturous path through numerous services and infrastructure components. Tracing provides timings and status for each hop of the route even if it includes multiple cloud providers and container technologies. Tracing data is the source for the key performance indicators of rate, errors, and duration (RED) for each service as well as the business functionality.
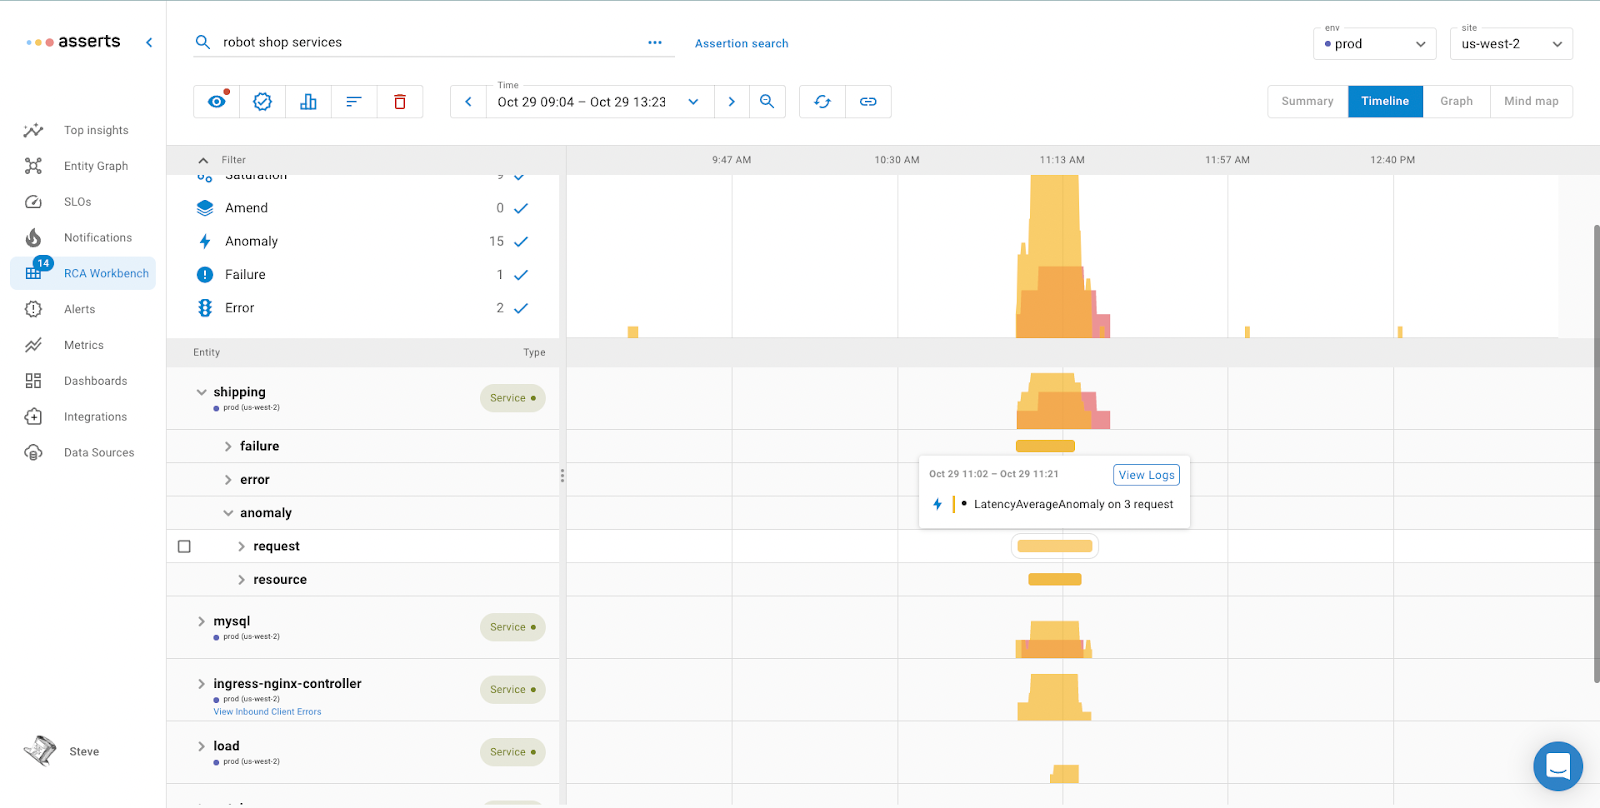
Detecting an anomaly in business functionality RED is the trigger for issuing an alert. The topology information that tracing provides is essential for establishing the root cause of the incident.
The Prosecution
Tracing is just structured logging at DEBUG level. Would you run logging at DEBUG in production? No! The overhead on the application services, log aggregation, storage, and network would be too much. But that’s exactly what is happening with tracing. Is the extra overhead and cost worth the benefit? Is there an alternative approach with less overhead and cost?
Tracing provides details of exit calls made from services to data stores, queues, and caches. This enables easy identification of poorly performing SQL/NoSQL queries. However, this can be achieved with regular logging. Some frameworks have slow query logging built in making implementation easy. The same approach can be used when services call external service providers such as payment gateways. Slow or erroneous requests can be logged, you're probably already doing this; tracing is double data entry.
Tracing data is used to calculate key performance indicators of rate, errors, and duration (RED) for each endpoint of a service by analysing the tracing spans. Why not just collect this directly inside the service, surely this is more efficient? Tracing libraries provide middleware for many frameworks, the same is true for metric collection. Prometheus middleware is available for many application frameworks which will collect endpoint performance as well as runtime metrics.
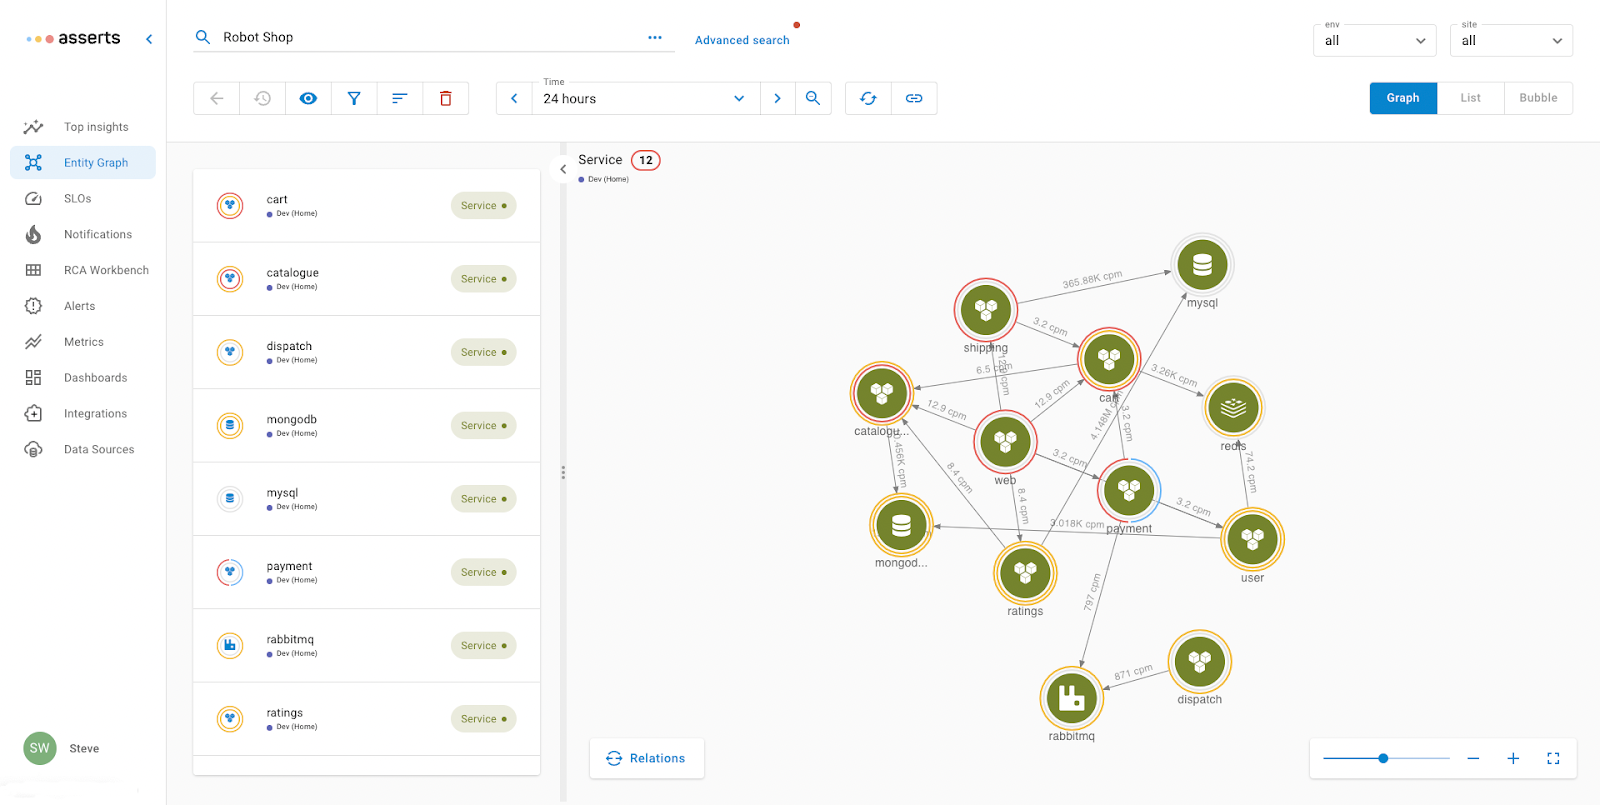
The topology of a microservices application can be determined by analysing the tracing spans. Alternatively performing a similar analysis on Prometheus metric labels can also determine the topology. Asserts can use metrics from a service mesh such as Istio or Linkerd, the Asserts eBPF agent as well as manual definition to discover application topology. The topology information is used to collate related services for root cause analysis if there’s a degradation on an SLO.
The Jury
There are powerful arguments both for and against tracing. With the use of metrics and logs along with Asserts, most of what tracing provides can be achieved with substantially lower overhead and cost. However, tracing still has its role to play in modern Observability tools which is why Asserts provides deep link integration to tracing tools just as it does for logging tools.
Tracing does really help when an application is deployed across multiple platforms e.g. Kubernetes, AWS Lambda, ECS, and bare metal where deploying an eBPF agent is problematic.
The verdict? It’s not yet time to exile tracing, it still has an important role to play but it is under caution for its abuse of resources. Therefore it is recommended not to skimp on logging detail and evaluate how Asserts can enable you to increase tracing sampling and restrain its excessive resource consumption. Contact Asserts for more information or sign up for a free trial.