Monitoring Springboot Applications with Prometheus and Asserts

Introduction
Springboot is a popular Java framework for building modern applications. With the help of the actuator module and the micrometer library, we can configure a Springboot application to expose performance metrics in the Prometheus format. Then we can set up a monitoring backend to consume these metrics. This blog provides a brief how-to, and on top of that, explains how the Asserts platform makes it super easy to monitor your Springboot application.
Configuring Springboot for Prometheus Metrics
First, you will need the actuator module to enable all the management endpoints, and the micrometer module to provide the prometheus endpoint that exposes Prometheus metrics.
dependencies {
    implementation 'org.springframework.boot:spring-boot-starter-actuator',
    Implementation 'io.micrometer:micrometer-registry-prometheus'
}
Second, make sure the prometheus endpoint is enabled in your application.properties or application.yml:
management.endpoints.web.exposure.include=info, health, prometheus
management.endpoint.prometheus.enabled=true
Now if you hit the /actuator/prometheus endpoint of your web application, you will see a list of metrics like these:
jvm_memory_used_bytes{area="heap",id="PS Survivor Space",} 2.012508E7
…
http_server_requests_seconds_count{exception="None",method="GET",outcome="SUCCESS",status="200",uri="/actuator/metrics",} 1.0
http_server_requests_seconds_sum{exception="None",method="GET",outcome="SUCCESS",status="200",uri="/actuator/metrics",} 0.084955379
…
http_client_requests_seconds_count{clientName="chief.tsdb.dev.asserts.ai",method="POST",outcome="SUCCESS",status="200",uri="/select/0/prometheus/api/v1/query",} 4785.0
http_client_requests_seconds_sum{clientName="chief.tsdb.dev.asserts.ai",method="POST",outcome="SUCCESS",status="200",uri="/select/0/prometheus/api/v1/query",} 238.762194814
…
By default, a Springboot application exposes JVM and HTTP request metrics, among other things. Micrometer also provides annotations like @Timed and @Counted for you to monitor individual methods:
package ai.asserts.tasks;

public class TimerTask {
    @Timed(description = "Time spent processing all tenants", histogram = true)
    public void run() {
        processAllTenants();
    }
    ...
}
These annotations produce method_timed_seconds metrics as Prometheus summary metrics and optionally histogram metrics if we set histogram = true.
method_timed_seconds_count{class="ai.asserts.tasks.TimerTask",exception="none",method="run",} 11.0
method_timed_seconds_sum{class="ai.asserts.tasks.TimerTask",exception="none",method="run",} 524.279248451
method_timed_seconds_bucket{class="ai.asserts.tasks.TimerTask",exception="none",method="run",le="0.001",} 0.0
…
If you want histogram metrics for HTTP requests too, you can enable them in your application.properties:
management.metrics.distribution.percentiles-histogram.http.server.requests=true
management.metrics.distribution.percentiles-histogram.http.client.requests=true
Be aware histogram metrics can quickly increase the number of time series you get, so enable them with caution.
Monitoring with Prometheus
Once the endpoint is ready, you can now configure your Prometheus server to scrape from this endpoint.
scrape_configs:
  - job_name: 'api-server'
    metrics_path: '/api-server/actuator/prometheus'
    static_configs:
      - targets: ['api.asserts.ai:8030']
After the metrics come in, you can start running PromQL queries in the Prometheus UI or use Grafana if you like a more sophisticated user experience.

You now have metrics in a monitoring system with minimal coding. So far so good! But your monitoring journey has only just begun. Now you will need to learn hundreds of metrics for your Springboot application and learn PromQL to query them. You also need to set up another service, AlertManager, and write some alert rules to notify you when things go wrong. Or perhaps you jump into Grafana, learn another new product and build some nice-looking dashboards that at times may be obsolete the moment you put them up. All in all, a lot of work is still ahead of you.
Monitoring with Asserts
What if you did not need to learn all these details? What if you did not need to put so much effort into building a monitoring infrastructure? With Asserts, you can forward your metrics to the Asserts cloud, and leverage a great platform that assists you in all aspects of your everyday monitoring work.
Setting up Asserts
If you have Prometheus already, setting up for Asserts is as simple as adding a few lines of Prometheus configuration to remote write to Asserts. Our Getting Started page documents how to do it.
Exploring your application
Metrics from your Springboot application carry a lot of context information. They indicate what services you have and what instances you have. When Asserts processes your metrics, it builds an entity graph automatically out of the metrics stream. All the entities in the graph are also indexed for search.
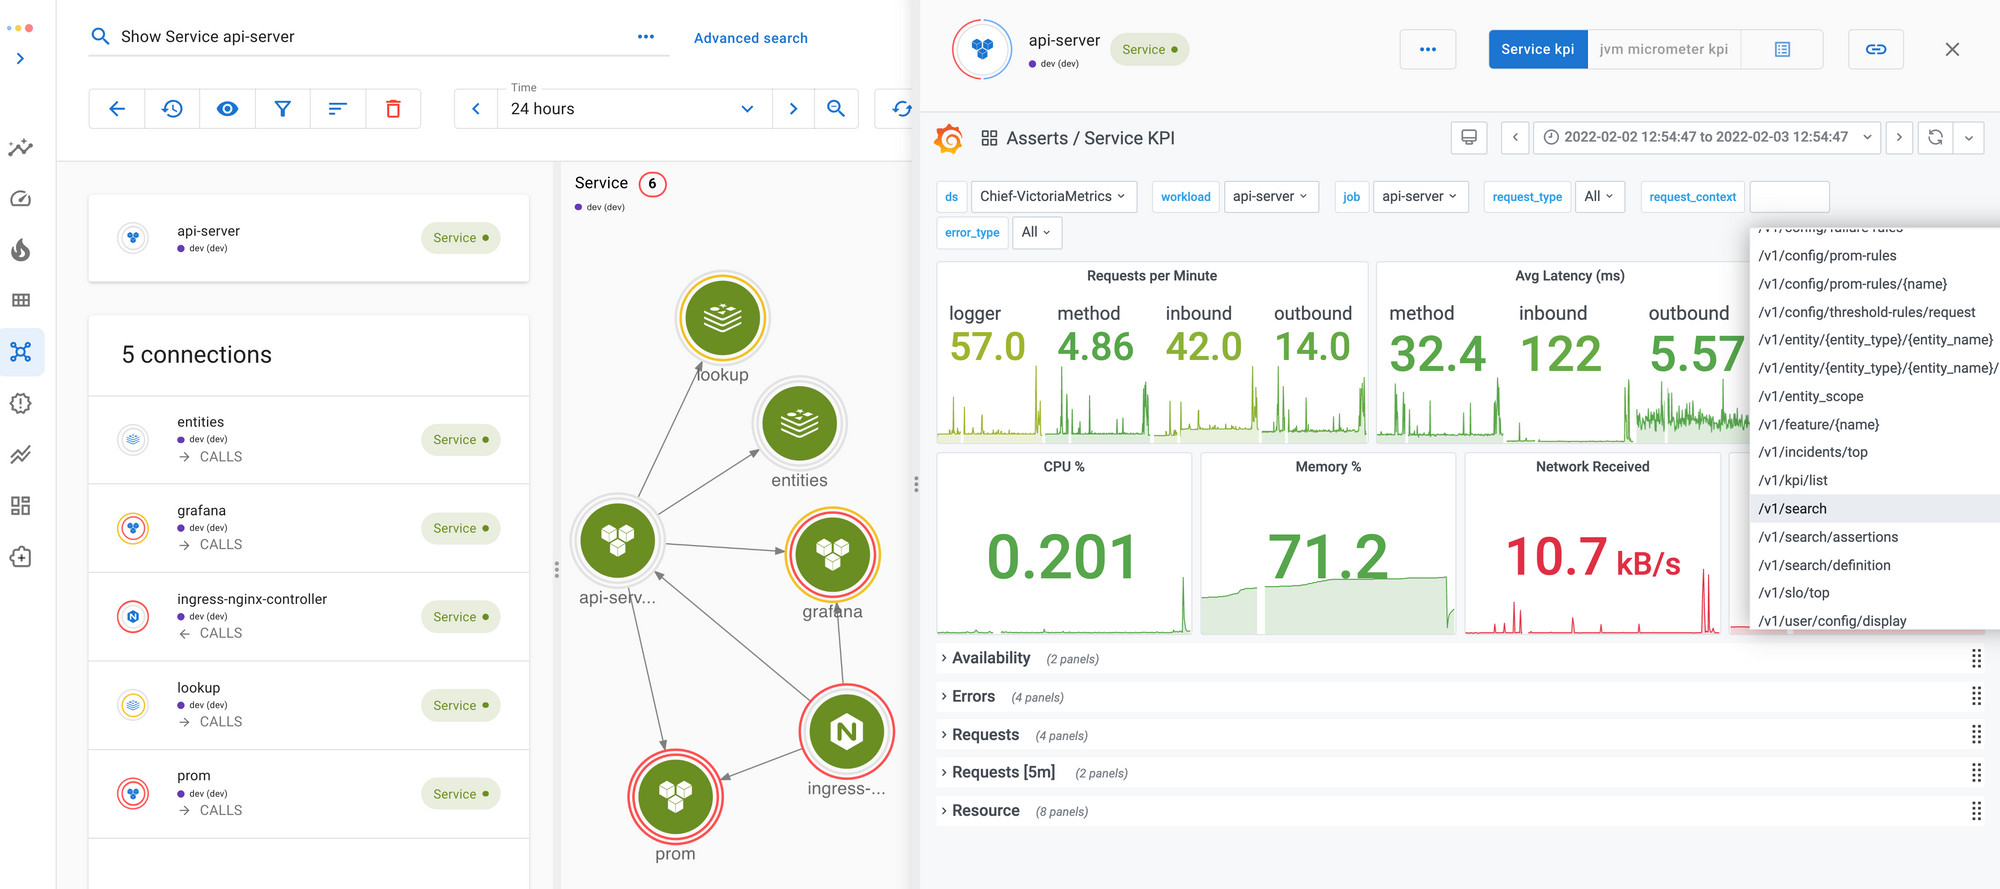
As metrics keep flowing, Asserts keeps updating the graph to reflect the fast-changing nature of a modern application. The more metrics you bring in, the richer the graph becomes. If you have your infrastructure metrics from node_exporter or cAdvisor, bring them to Asserts. Now you can see all your application entities and infrastructure entities together. For example, the following screenshot shows a Springboot service called api-server and its namespace asserts and the two pods it runs on.

Beyond searches, Asserts provides many other ways to navigate the graph to explore your application. Asserts also has built-in dashboards tailored for each type of entity. While focusing on an entity, you can pull out its corresponding dashboards with one click. For example, the Service KPI dashboard below shows all the API endpoints. All the request rate, latency, and error metrics reported by Springboot are available for these endpoints. All the methods annotated with @Timed and @Counted are also available in the dashboard.

Knowing what’s going on
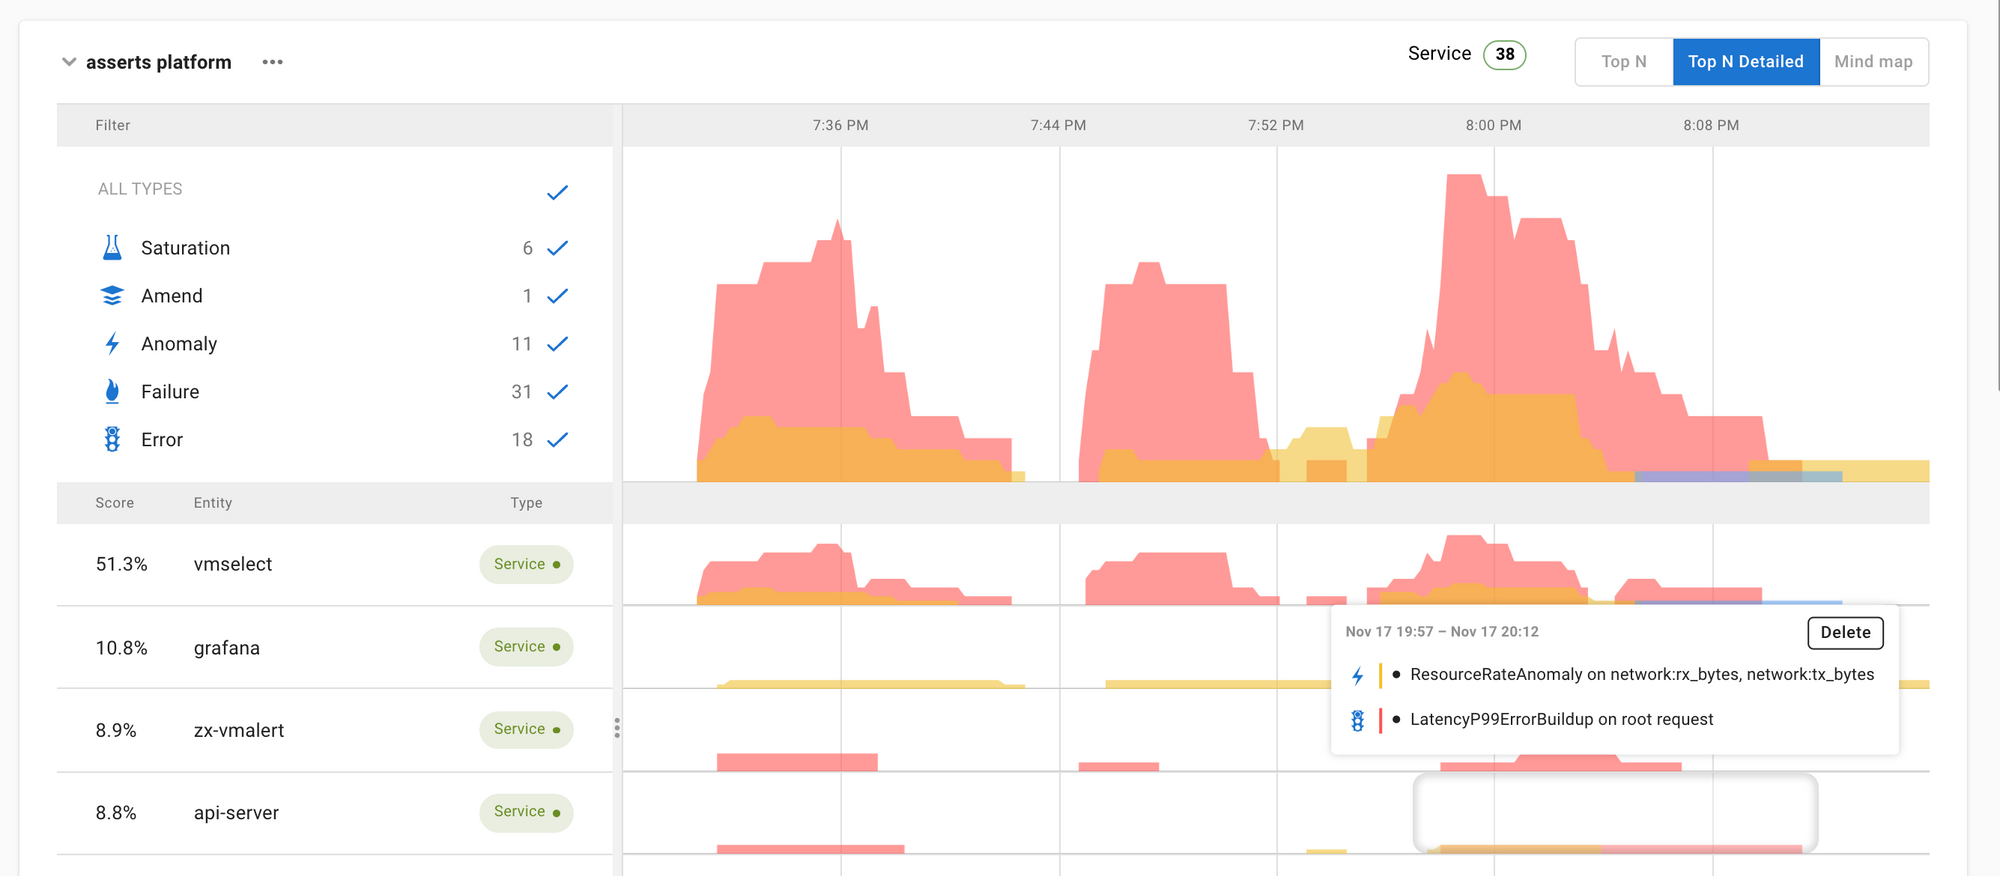
When you have your Springboot metrics and other metrics in Asserts, the platform automatically monitors them and surfaces key signals about what’s going on in your application. We call these signals Assertions and categorize them into our SAAFE taxonomy to help you focus on what they represent: resource saturation, system amendments, traffic anomaly, errors, and component failures.
The search interface provides different ways to explore these Assertions:
- You can search them in the graph with our built-in search expressions.
- You can use the "Advanced search" function to correlate assertions to your services and other entities.
- You can also search them in the Workbench view to lay them out in a timeline for troubleshooting.

In addition, Asserts’s Top Insights automatically surfaces services that are experiencing the most problems. This feature serves as a quick shortcut to monitor your application’s overall health.
Getting notified when things go wrong
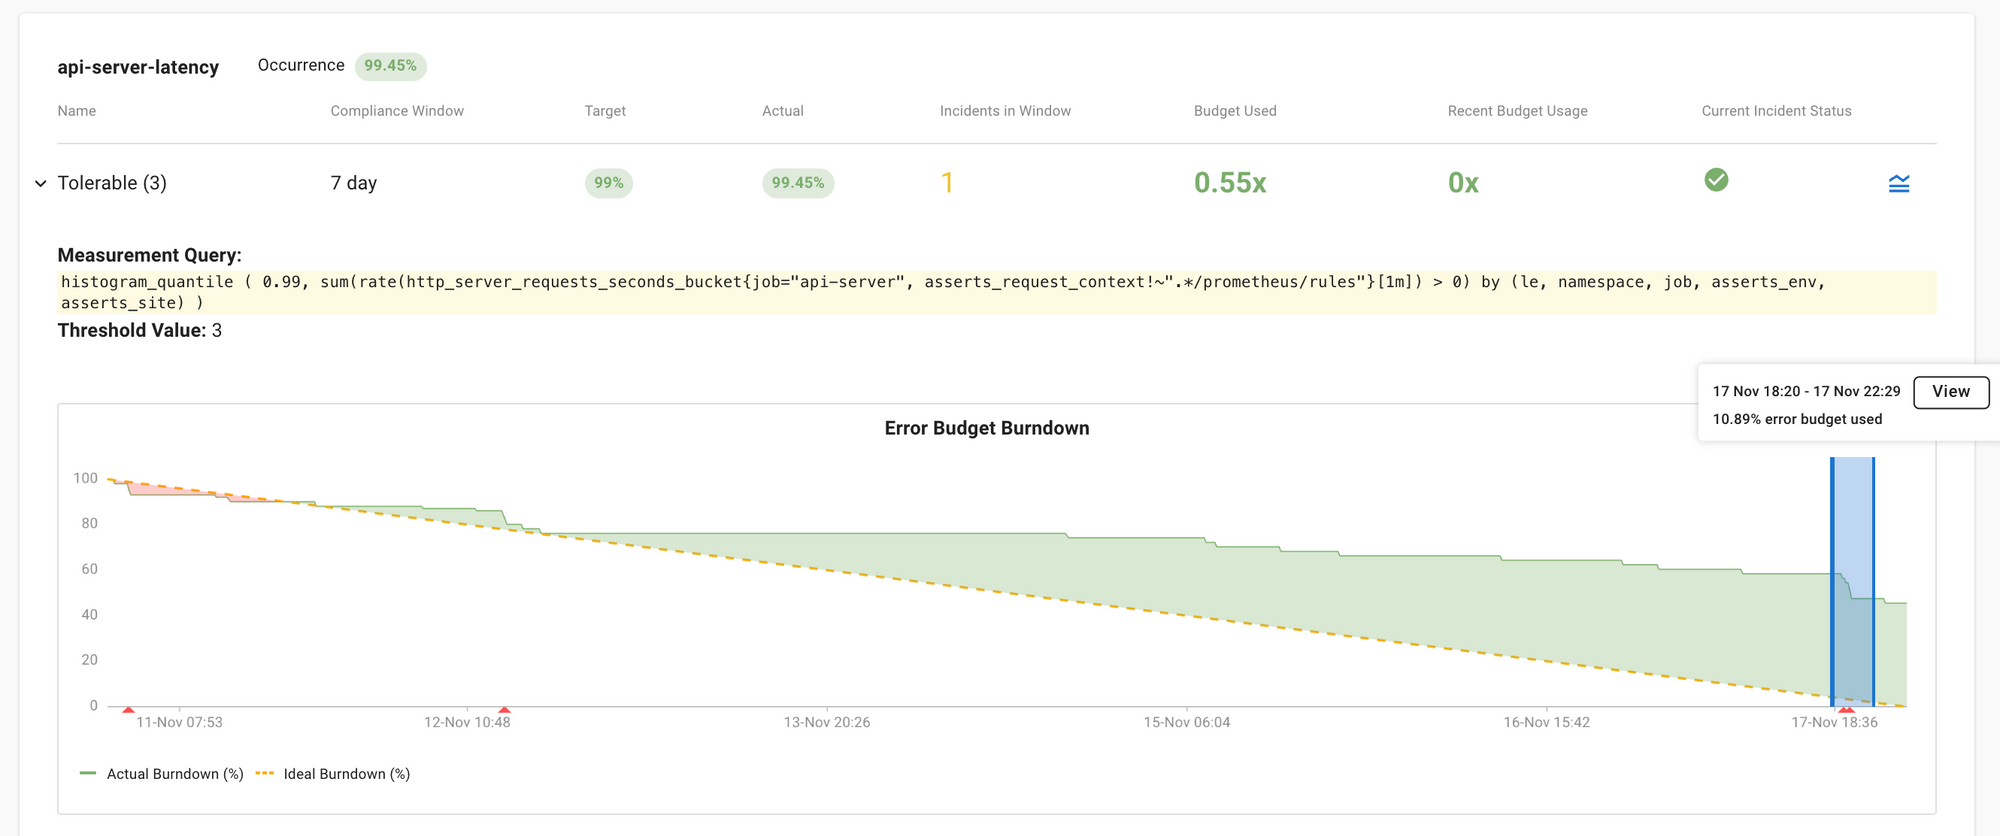
You can choose to get notified when some of the Assertions are detected, but these raw signals can be a bit noisy. Asserts instead encourages you to define SLOs for your services and get notified when your SLO is on the trajectory to breaching. Asserts’s Manage SLOs page provides a simple interface to specify SLOs. You can monitor how your error budget is holding up. If there is a significant drop in the burndown, an incident will be triggered, and a notification will be sent to your configured channels (Email/Slack/Pagerduty, etc.).
Troubleshooting
The troubleshooting process often involves looking at a few different entities and signals together to deduce causality from correlation. Asserts has made this task very easy with a Workbench feature. To troubleshoot an incident, you can directly add it to the Workbench.
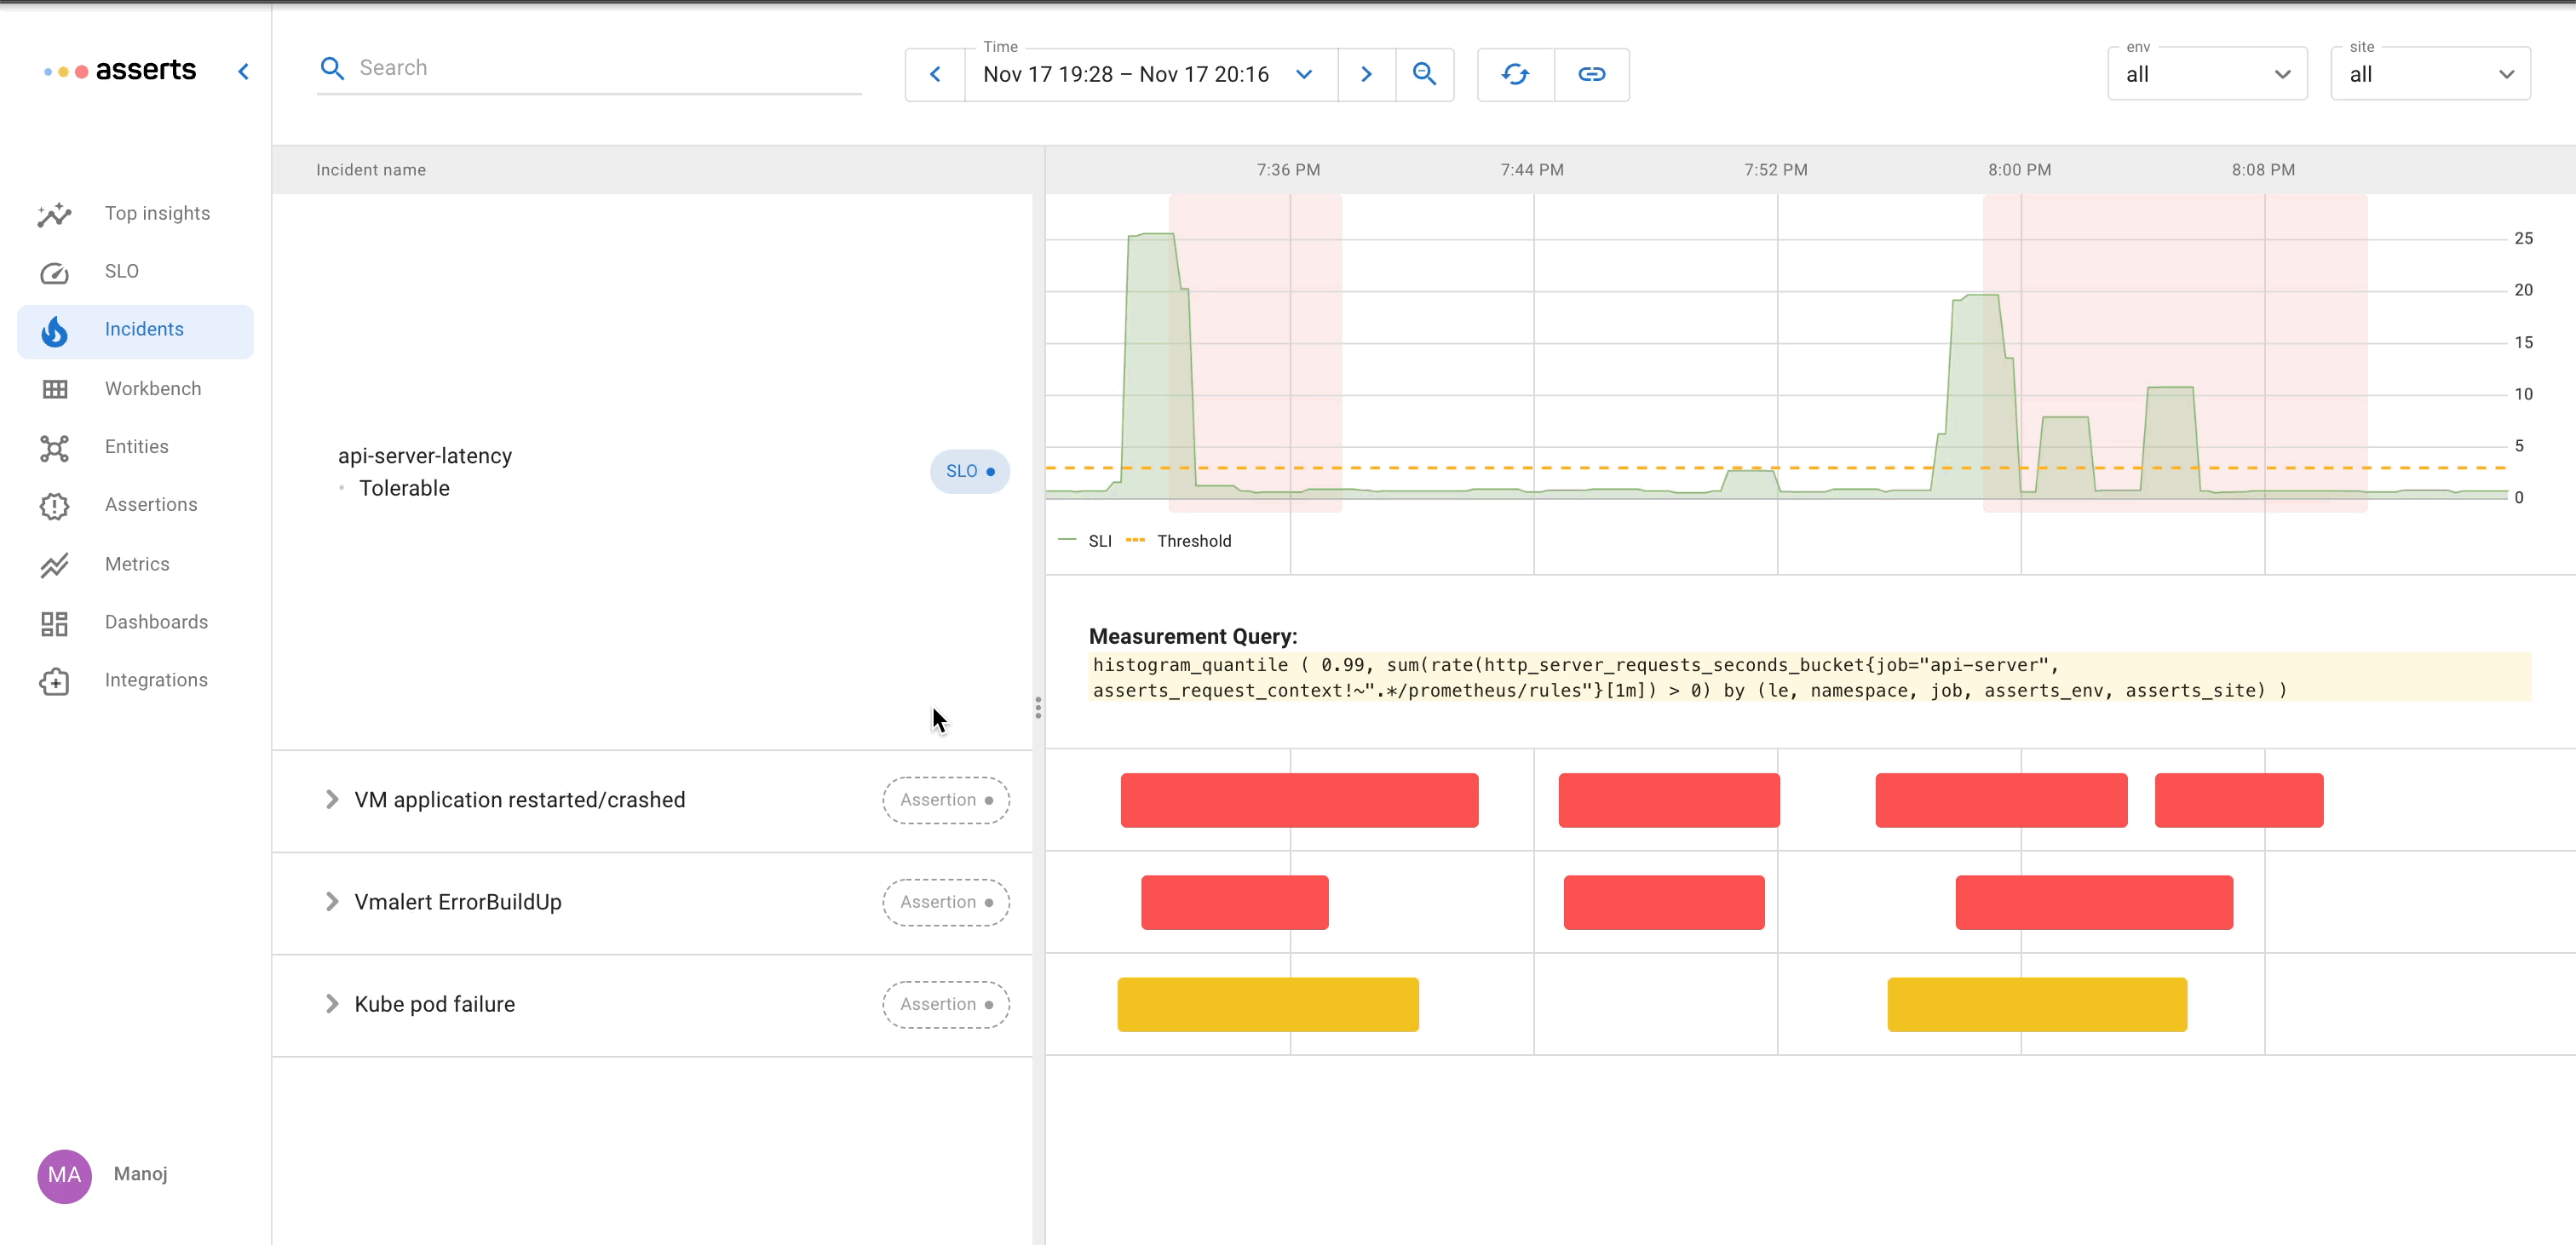
All the Assertions related to an incident can be plotted together in the same time frame. Because Asserts understand the topology of your application, we make it very easy for you to put related components side-by-side in the Workbench. You can often find out the root cause of an incident in a few clicks. For an example troubleshooting process, you can check out our announcement blog.
Summary
In this blog, we demonstrated how to set up Springboot applications to export metrics in Prometheus format, but that only solves the first piece of your monitoring problem. As such, we then demonstrated how Asserts makes it very easy to address the rest of your observability needs. To learn more about how Asserts helps, please visit our website or check out our documentation.