Golden Signals - Latency

Observability of modern cloud-native applications should provide deep visibility into an application’s performance, call attention to problems brewing through high fidelity alerts and provide an intuitive troubleshooting experience that shouldn’t require expert domain knowledge. With the advent of open-source approaches either based on OpenTelemetry or the ubiquitous Prometheus exporters as well as metrics exposed by cloud providers (e.g., Amazon CloudWatch), we now have a plethora of metrics available for us to aid in this pursuit.
Now that we have the metrics, how do we utilize them? A good framework to start with is the Golden Signals - a term that shot into prominence with the Google SRE book. It refers to the four golden signals of monitoring - latency, traffic, errors, and saturation. In this blog post, we will look at latency in a bit more detail and cover the others in subsequent blog posts.
Challenges in Monitoring Latency
Latency is the time it takes to service a request. Latency distribution is known to have long tails, so it’s best captured as a histogram metric. When it comes to latency, occasional spikes are typically not a problem. Only when it occurs enough times to push the percentile values (say p95 or p99) over an acceptable value does it become a problem. Anomalous changes to latency patterns are a potential source of issues too.
Let's look at a few real-world scenarios in which latency problems manifest as:
- A sudden spike in traffic causing saturation of resources and an increase in latency
- A new deployment causing the latency to go up
- Issues with downstream services causing latency to go up. The increase in latency in the downstream system itself could be marginal, but multiple calls to such services can add up and cause slowness in the upstream service
- An increase in errors causing the latency to go up or in some cases to go down
- A decrease in throughput of the system and an increase in latency and network usage at the same time (due to bigger request payloads that take more time to process)
How does one troubleshoot these problems? In modern distributed systems rarely do problems happen in isolation. So it’s important for your monitoring solution of choice to not only surface the problem, but to present it in the context of all the other relevant information. Present the right set of signals, and a human eye can spot the problem in no time.
Monitoring Latency with Asserts
Now that we have an appreciation of the challenges involved, let’s see how this experience would look with the power of Assertions and SLOs in Asserts.
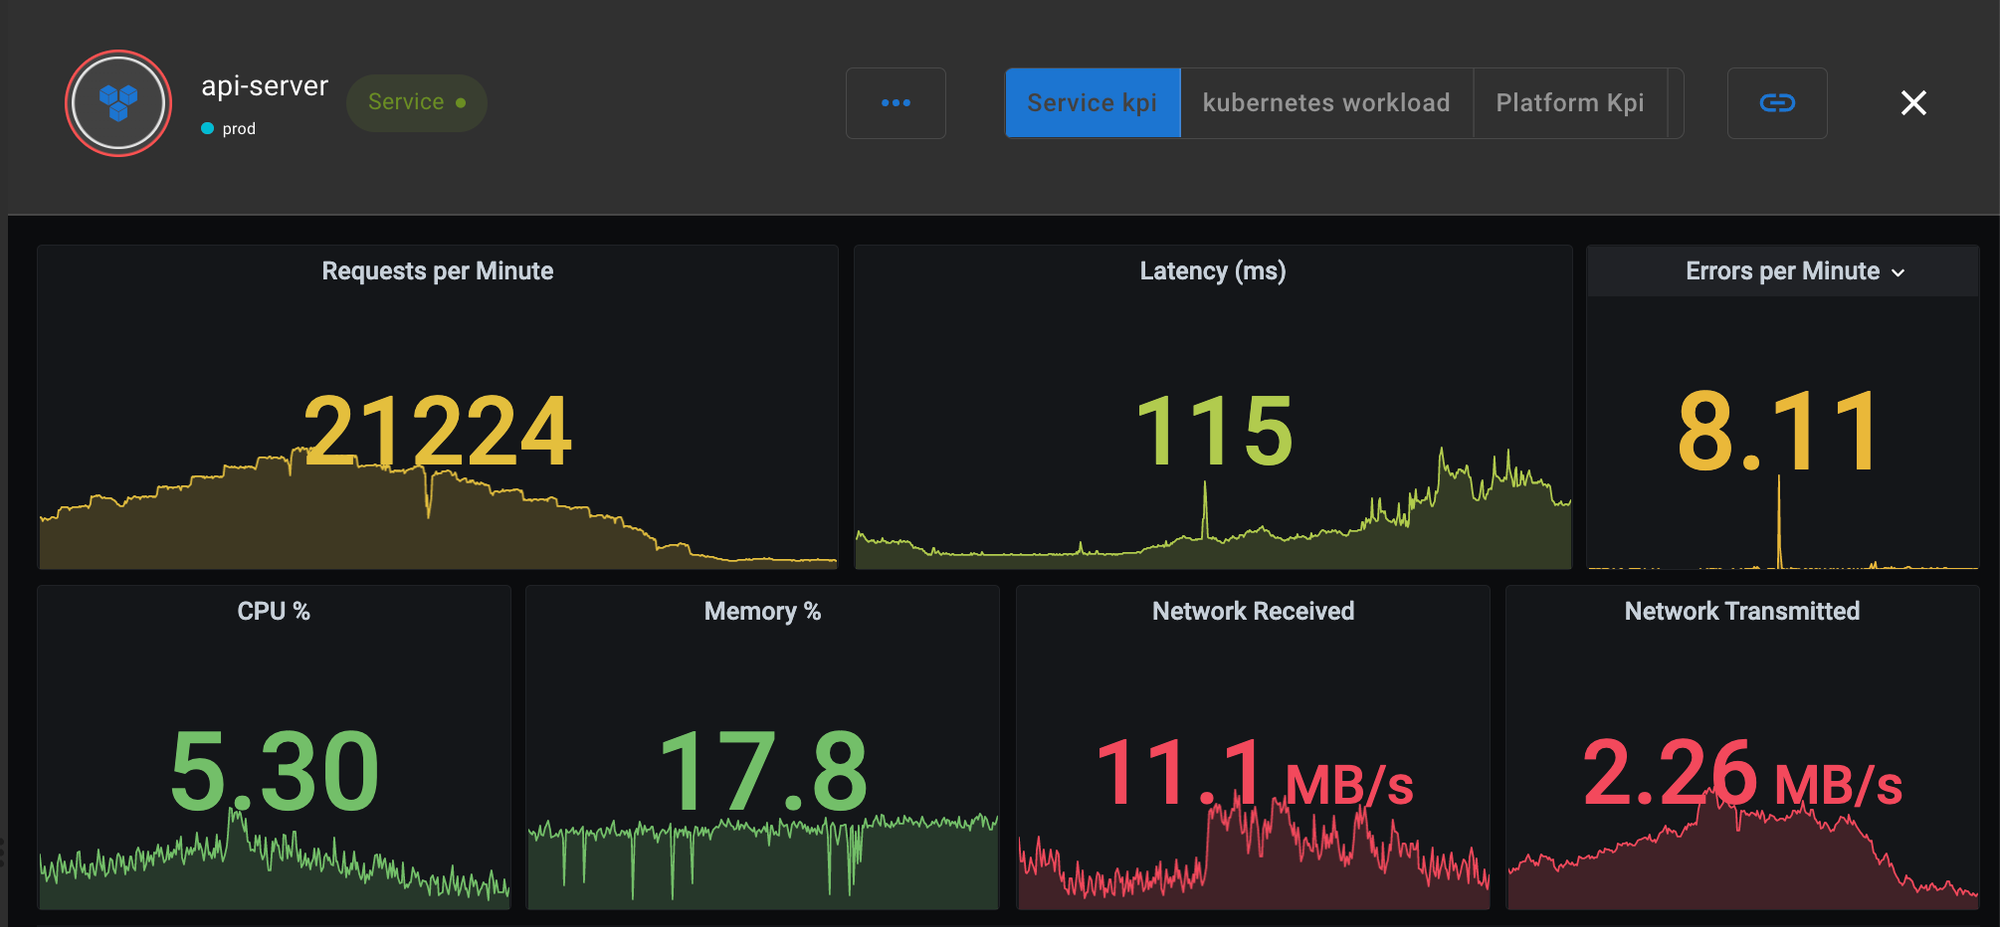
A quick primer on Assertions - Upon receiving raw time-series data, Asserts platform instruments them with our domain knowledge and surfaces key signals about what’s going on in your application. We call these signals Assertions and categorize them into our SAAFE taxonomy to help you focus on what they represent: resource saturation, system amendments, traffic anomaly, errors, and component failures.
Asserts has three types of latency assertions:
- LatencyAverageAnomaly - to detect if latency falls outside a normal range
- LatencyAverageBreach - to detect if latency average is above a static threshold
- LatencyP99ErrorBuildup - to detect if there is a buildup of slow requests (with p99 above a configured threshold) that otherwise cannot be detected by LatencyAverageBreach.
Let’s look at each of them in more detail.
LatencyAverageAnomaly
This assertion is fired when the latency metric veers outside a band computed by Asserts. These bands are dynamic, with daily and weekly seasonalities considered. When this assertion occurs, it in conjunction with other related assertions could be revealing. See an example below where the latency of api-server’s /v1/query_range api going above the band coincides with the same api experiencing a significantly higher error ratio.
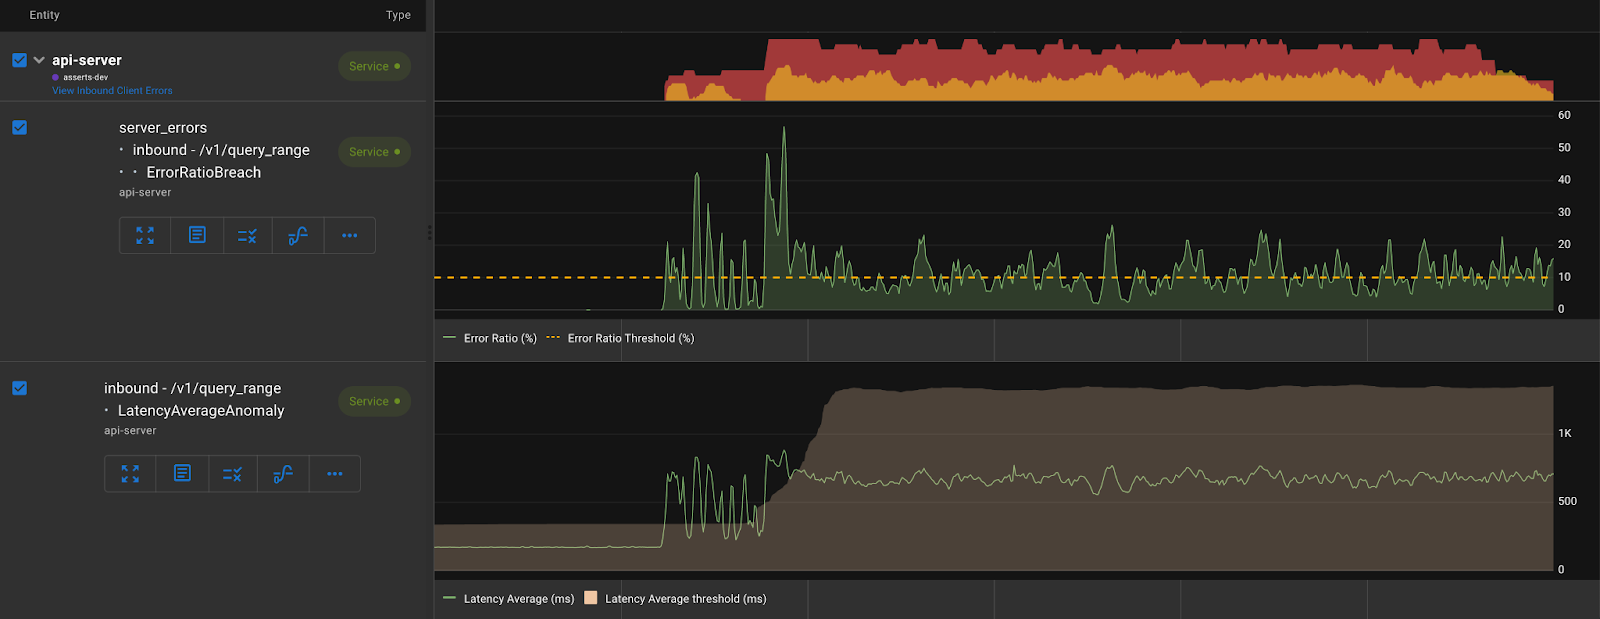
Asserts discovers your application and infrastructure components and their relationships from the metrics and uses this knowledge to correlate assertions. As seen in the picture above, Asserts workbench groups and presents these assertions along with all the contextual information required to make troubleshooting simpler.
LatencyP99ErrorBuildup
Durations/time windows where the p99 latency is above a configured threshold indicate a potential problem. As we discussed earlier, occasional spikes in latency are not an issue unless there is a buildup of those. To detect if it’s occasional or sustained, Asserts computes a ratio of erroneous durations over the last 5 minutes and the last 1 hour and fires this assertion if it exceeds a threshold. This is known as the multi-window multi-burn-rate approach, as explained in the Google SRE book. This ensures that the assertion when it fires indicates a real issue while at the same time it is quick to reset as soon as the latency comes back to normal.
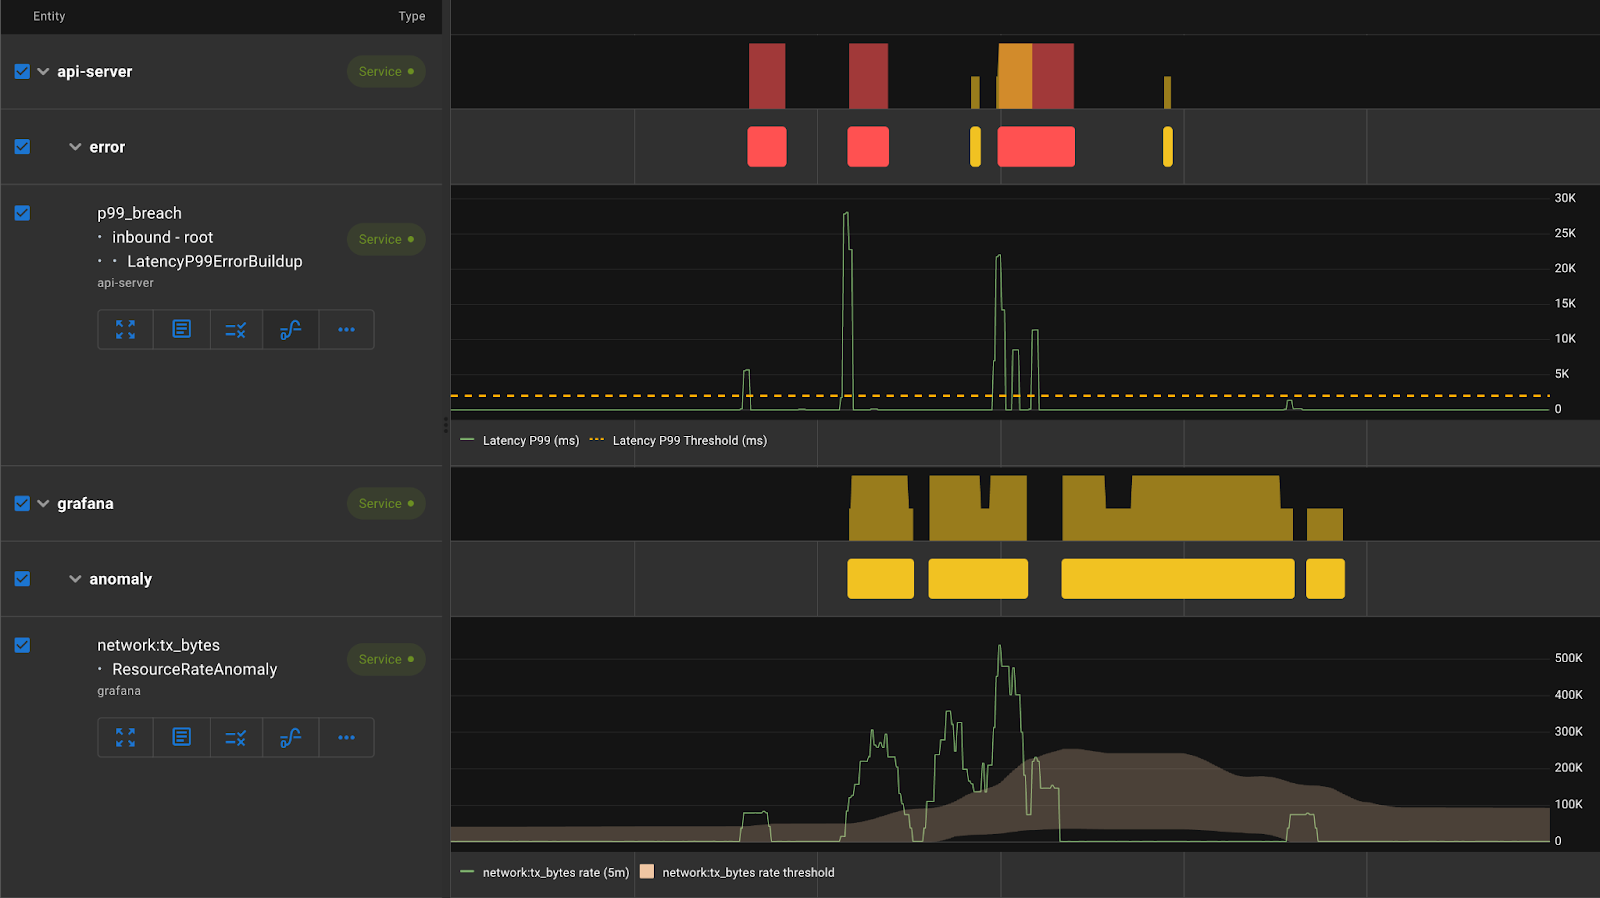
Here we see that along with detecting the latency p99 error buildup, we can use the Asserts workbench to correlate it with a spike in network traffic in the Grafana service, which is a downstream dependency for the api-server.
LatencyAverageBreach
This assertion is fired when the latency average exceeds the configured threshold value.
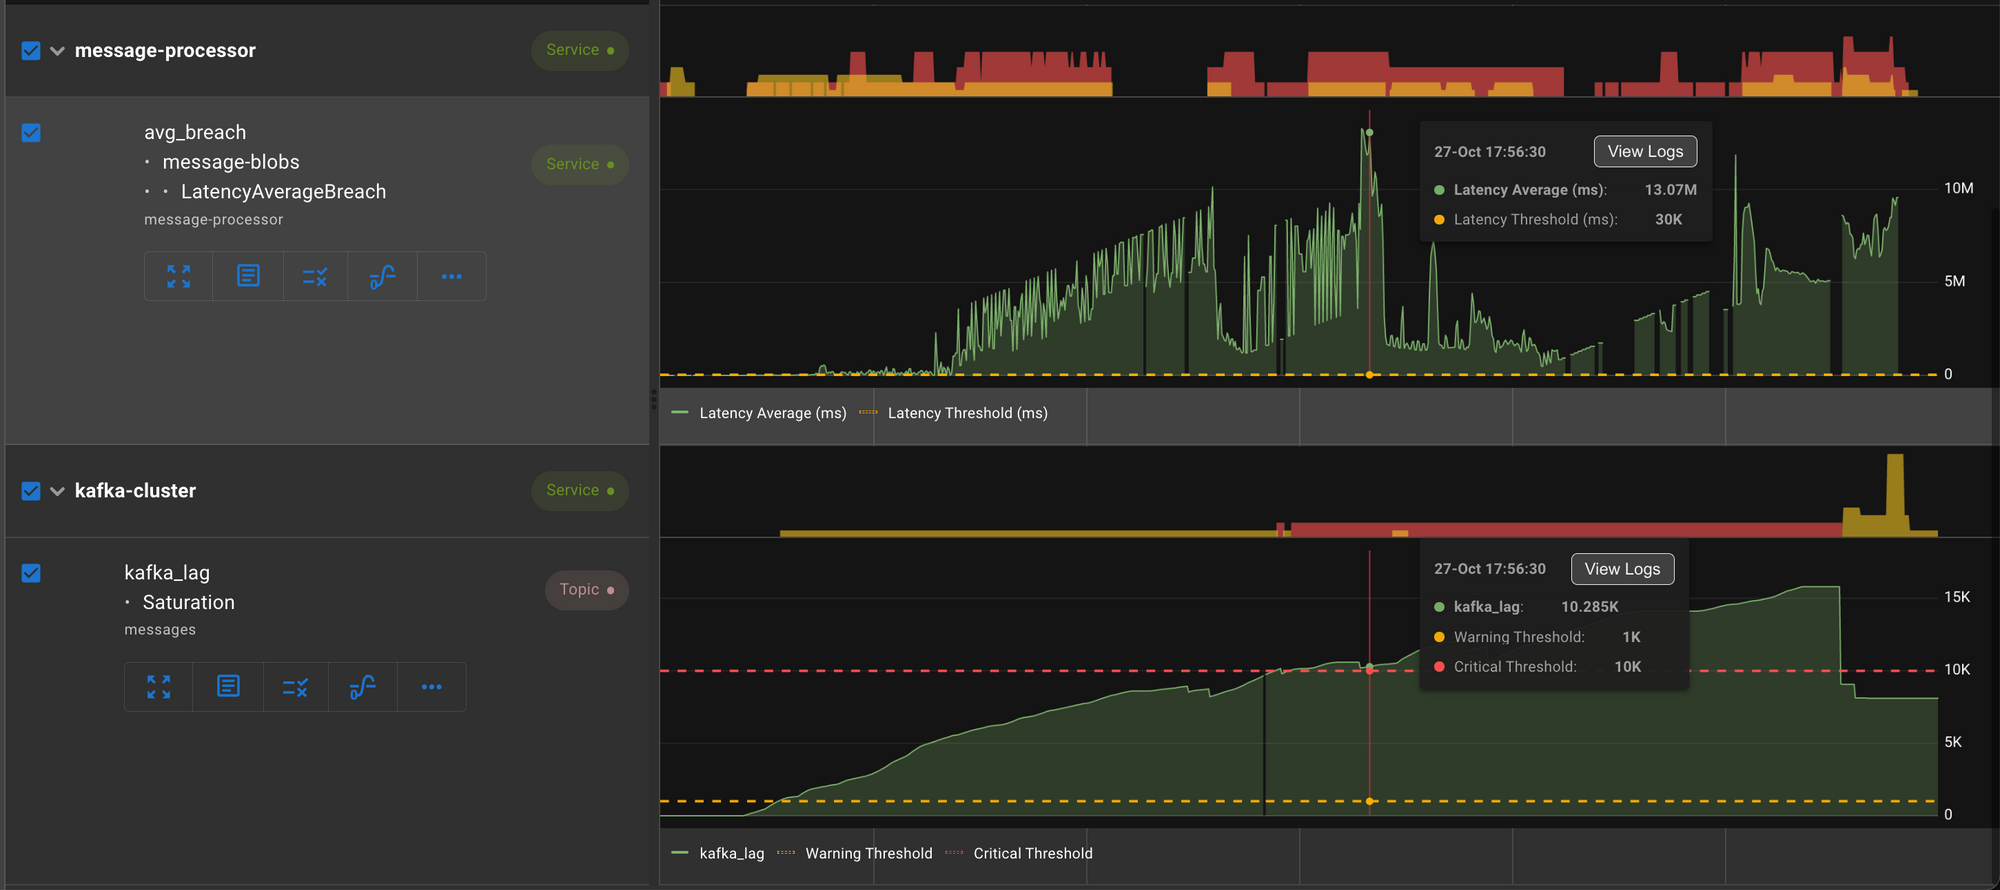
Here we see a spike in latency in message-processor service triggered a lag in Kafka topic.
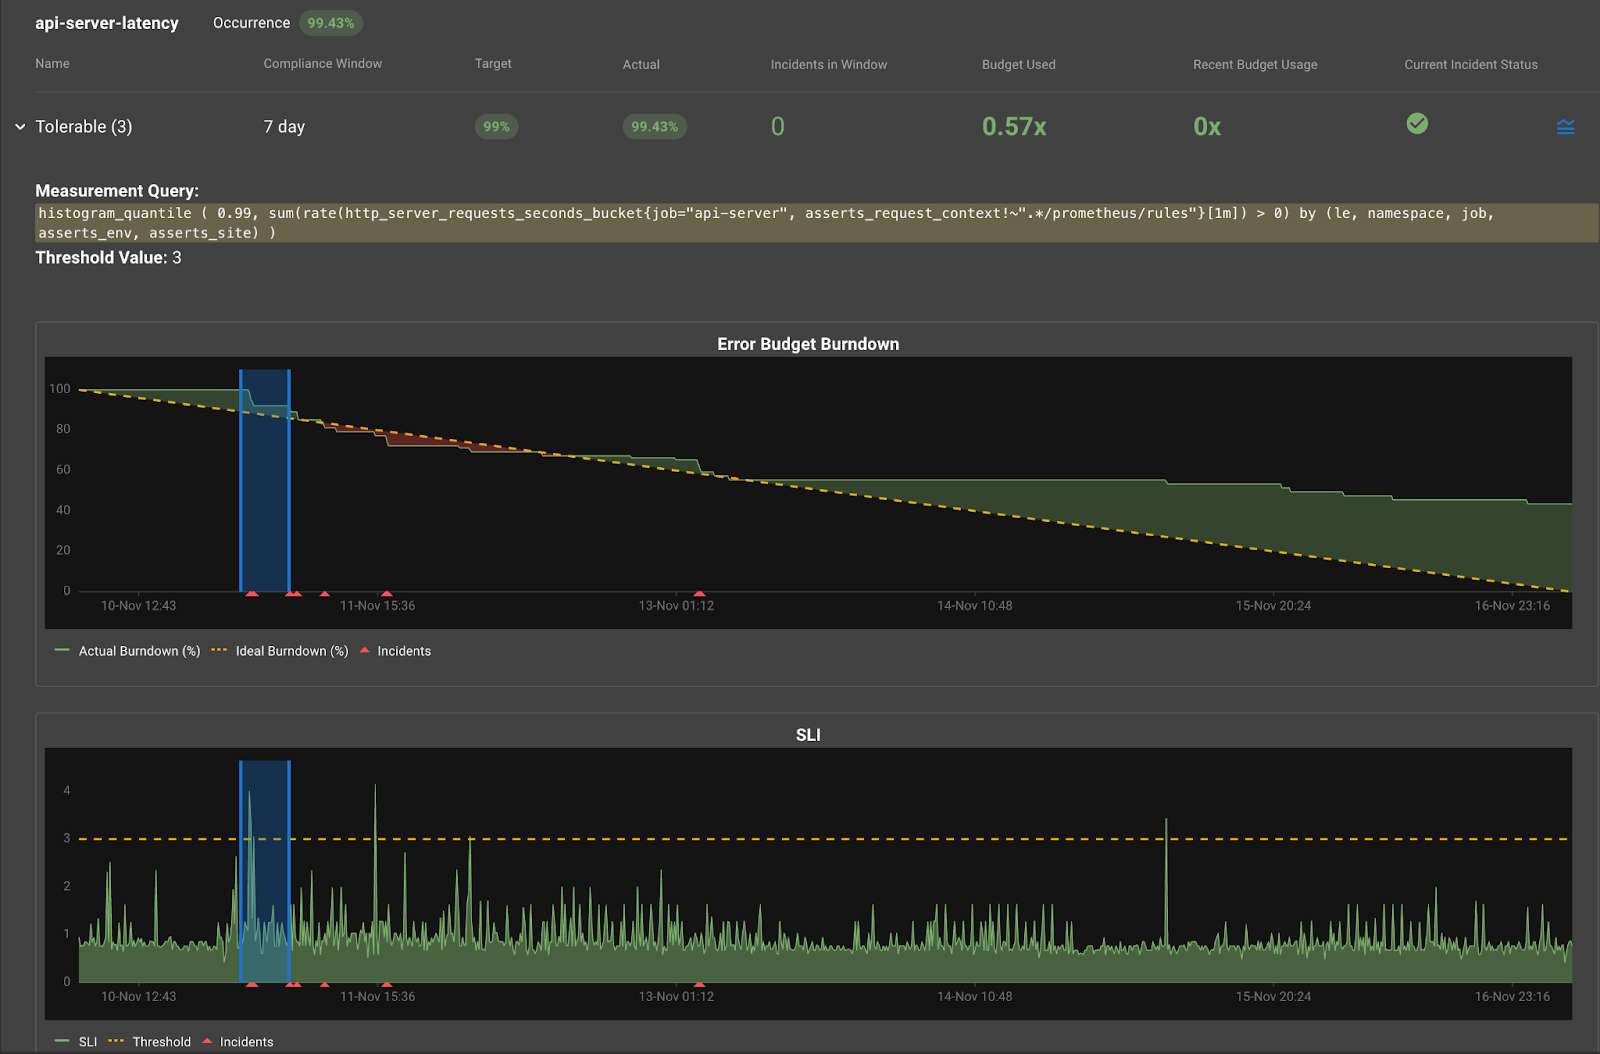
Alerting with Latency SLOs
Assertions are great troubleshooting aids and can be considered for alerting. But a better approach is to devise an alerting strategy based on SLOs as they measure how your application stacks up against stated business objectives.
Latency metric can be used as a Service Level Indicator (SLI) to define an SLO - e.g., P99 for Checkout Service should be within 500ms over the last seven days. This SLO allows the P99 value to go over 500ms only for 100 minutes in a week. Anything above that, then the SLO is in violation. This is known as the error budget, which states how long the latency can be above the threshold before the SLO starts violating.
Monitoring the error budget consumed and alerting when that budget is being spent at a rate fast enough to risk the SLO getting violated will ensure that any alert raised is a symptom of a real problem that needs investigation right away. Asserts uses a multi-window multi-burn-rate approach to ensure the alerts fired are of high precision and high recall with low detection and reset times.
Conclusion
In this blog post, we looked at the latency metric in detail and how Asserts provides the contextual intelligence required to troubleshoot issues. In subsequent blog posts, we will look at how best to get value from the other golden signals - request, errors & saturation. If this interests you, feel free to check out our blogs and take our product for a spin.