Why My P99 < Average

We use both average and quantiles to measure latencies, but monitoring tools often have limitations with percentiles, which sometimes produce counterintuitive results. While investigating a latency problem, we noticed that Prometheus -- the system we use for monitoring -- reported the P99 latency for our app was less than the average latency. How could that be?
Even though this is mathematically possible, what we discovered is not about the statistical nuance, but a limitation of Prometheus’s histogram_quantile function. In this blog post, we share our findings. Our experience can help you improve latency monitoring if you are also using Prometheus.
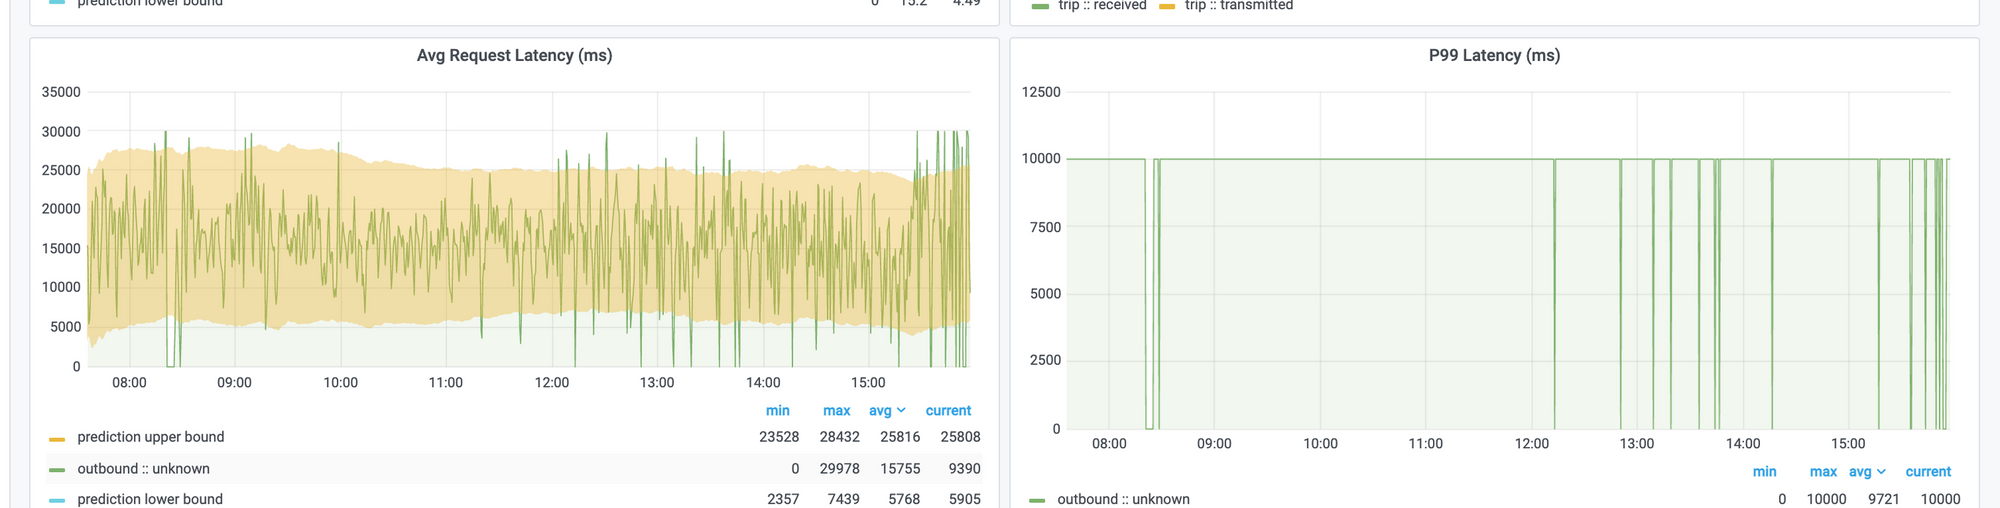
In Asserts dashboards, we place average latency and P99 latency side-by-side, and one time we observed the following:

Note that the P99 latency on the right is 10 seconds, but the average latency on the left is around 15 seconds. So what's happening here?
For this particular case, we use the histogram_quantile function to calculate the P99 latency. This function relies on a collection of buckets that count the number of requests with latency less or equal to a pre-defined value:
request_duration_seconds_bucket{job="foo", instance="i", le="+inf"} 100
request_duration_seconds_bucket{job="foo", instance="i", le="10"} 90
request_duration_seconds_bucket{job="foo", instance="i", le="5"} 80
...
request_duration_seconds_bucket{job="foo", instance="i", le="0.1"} 50
...
In this illustrative example, we have 100 request latencies, 90 of which are less or equal to 10 seconds and 50 of which are less or equal to 0.1 seconds. The buckets are cumulative, so the bucket for “le=10” also counts the requests that have latencies less than 0.1 seconds.
If we ask Prometheus to calculate P90, it is 10 seconds, and P80 is 5 seconds, but what about P85? We only know that 80% of latencies are less than or equal to 5 seconds, and 90% are less than or equal to 10 seconds, so the P85 must be somewhere between 5 seconds and 10 seconds. In this case, histogram_quantile does a linear interpolation between 10 seconds and 5 seconds and returns a number in between. This is bound to have some estimation errors, as explained in the “Errors of quantile estimation” section in the Prometheus documentation.
Now when more than 1 percent of the requests have latency higher than 10 seconds, if you calculate P99, it will be a linear interpolation between 10 seconds and +inf, which will return 10. What if more than half of the requests have latencies above 10 seconds? In this case, the estimated P99 is still 10 seconds, but the average or the median could be well above 10 seconds.
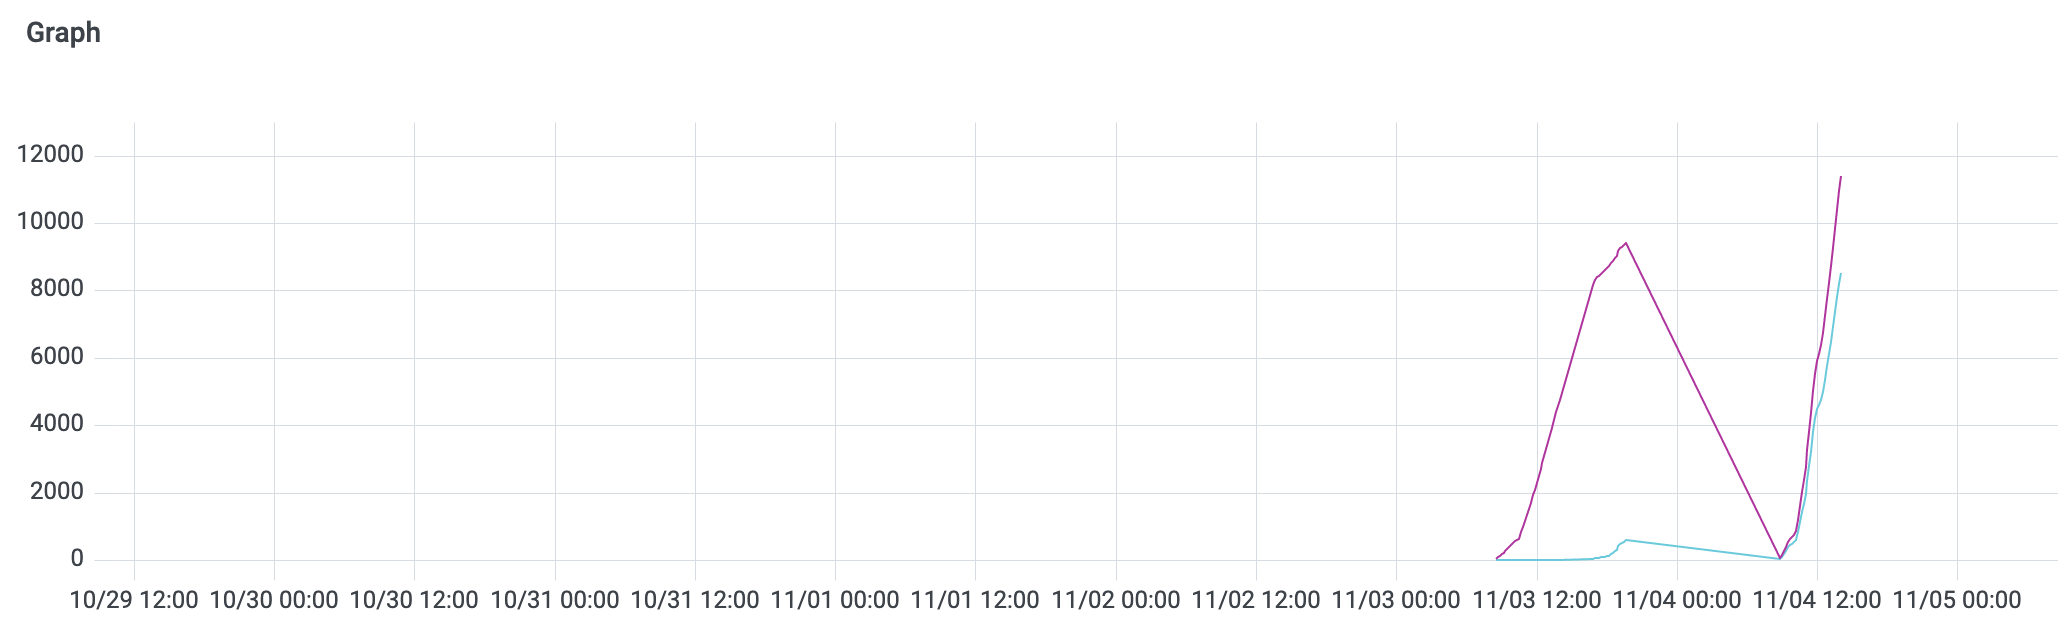
Indeed, that’s what happened with the above example. If we compare the two buckets “le=+inf” (purple line) and “le=10” (aqua line), we can see that we always have some requests with latencies above 10 seconds. Sometimes most of them are above 10 seconds.
So this is a limitation of the Prometheus histogram. It has fixed buckets, and client libraries use a max bucket at 10 seconds by default. We then realize that the instrumented code itself can choose its own buckets. After reviewing our actual latency numbers, we added more buckets above 10 seconds, which has improved our estimated P99 accuracy. If your application often has more than 10 seconds of latency, you'll get a much better P99 estimation if you do the same.