Monitoring React Applications with OpenTelemetry
OpenTelemetry offers a unified monitoring solution for React apps, providing standardized and vendor-agnostic observability. This article provides a practical example and initial setup for instrumenting your application with OpenTelemetry.


While observability frameworks have traditionally focused on monitoring backend services, there is a growing need for a unified monitoring solution that covers all aspects of an application. Although monitoring client applications with observability frameworks is not yet a widespread practice, it can be incredibly beneficial.
In a previous blog post, we discussed monitoring React applications using Prometheus. Today, we will explore how OpenTelemetry can be leveraged to monitor React applications, providing a comprehensive monitoring tool for all components of your application.
OpenTelemetry is an open-source observability framework designed to help developers and operators instrument, collect, and analyze telemetry data from their applications and systems.
The main goal of OpenTelemetry is to provide a standardized and vendor-agnostic solution for observability, enabling developers to gain insights into the performance and behavior of their applications in a consistent manner, regardless of the underlying technologies and environments.
OpenTelemetry instrumentations
OpenTelemetry provides several instrumentation options available for web applications:
@opentelemetry/instrumentation-document-load - provides automatic instrumentation for document load.
@opentelemetry/instrumentation-fetch - provides auto instrumentation for web using fetch.
@opentelemetry/instrumentation-user-interaction - provides automatic instrumentation for user interactions.
@opentelemetry/instrumentation-xml-http-request - provides auto instrumentation for web using XMLHttpRequest.
Adding OpenTelemetry to React application
Let's consider an example of how to integrate OpenTelemetry into a React application.
Step 1: Set up a simple React project with Vite
# npm 6.x
npm create vite@latest my-react-app --template react-ts

# npm 7+, extra double-dash is needed:
npm create vite@latest my-react-app -- --template react-ts

# yarn
yarn create vite my-react-app --template react-ts

# pnpm
pnpm create vite my-react-app --template react-ts
Now run:
cd my-react-app
npm install
npm run dev
Done! We have a simple working React app!
Step 2: Install OpenTelemetry packages
npm install @opentelemetry/api \
  @opentelemetry/sdk-trace-web \
  @opentelemetry/auto-instrumentations-web \
  @opentelemetry/context-zone \
  @opentelemetry/resources \
  @opentelemetry/semantic-conventions
To leverage the most common instrumentations all in one we will use the @opentelemetry/auto-instrumentations-web for simplicity.
Step 3: Initializing OpenTelemetry instrumentations
Let's add all the code to main.tsx file for simplicity.
import React from 'react';
import ReactDOM from 'react-dom/client';
import App from './App.tsx';
import './index.css';
import { registerInstrumentations } from '@opentelemetry/instrumentation';
import { getWebAutoInstrumentations } from '@opentelemetry/auto-instrumentations-web';
import { ConsoleSpanExporter, SimpleSpanProcessor, TracerConfig, WebTracerProvider } from '@opentelemetry/sdk-trace-web';
import { ZoneContextManager } from '@opentelemetry/context-zone';
import { SemanticResourceAttributes } from '@opentelemetry/semantic-conventions';
import { Resource } from '@opentelemetry/resources';
const providerConfig: TracerConfig = {
resource: new Resource({
[SemanticResourceAttributes.SERVICE_NAME]: 'my-react-app',
}),
};
const provider = new WebTracerProvider(providerConfig);
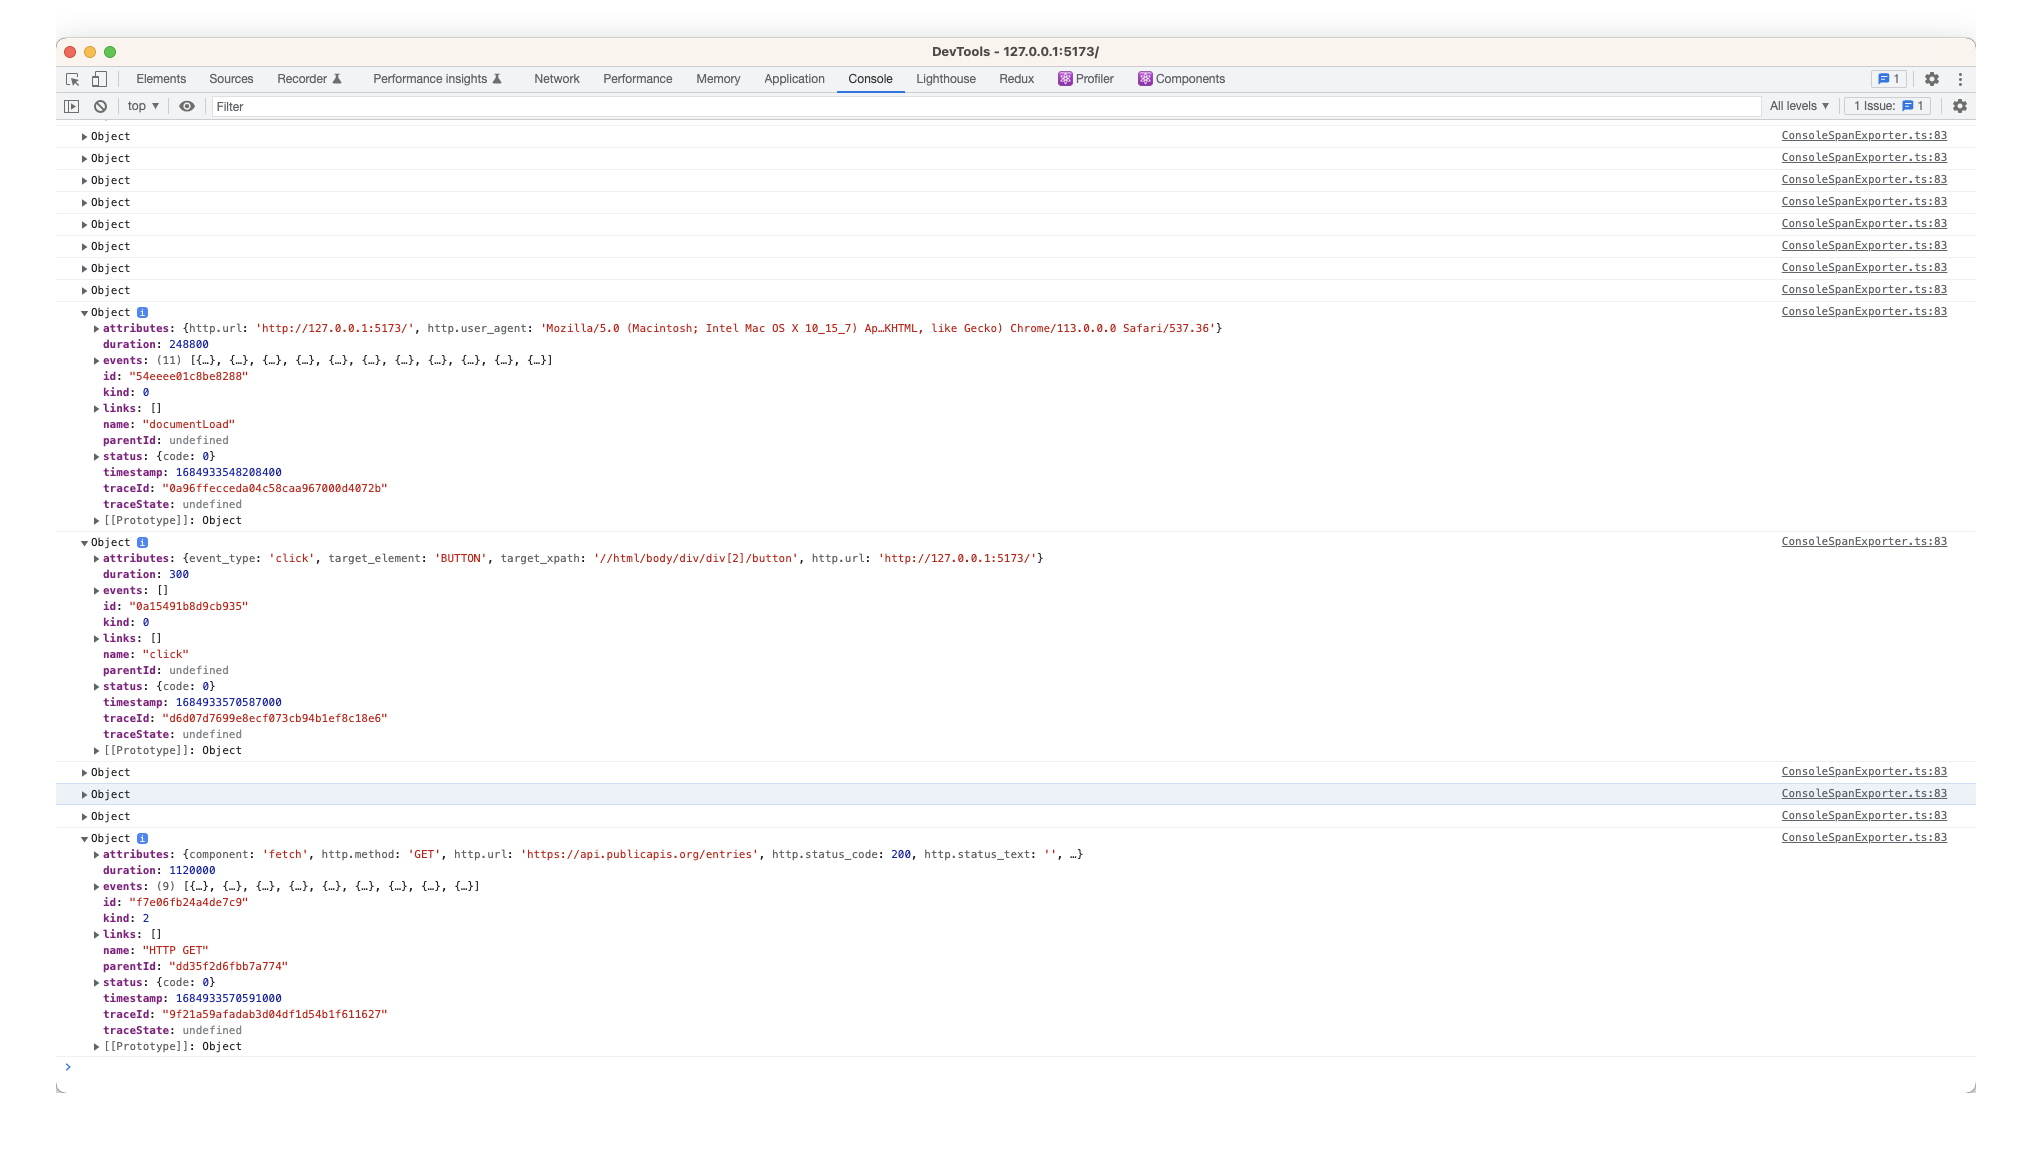
// we will use ConsoleSpanExporter to check the generated spans in dev console
provider.addSpanProcessor(new SimpleSpanProcessor(new ConsoleSpanExporter()));
provider.register({
contextManager: new ZoneContextManager(),
});
registerInstrumentations({
instrumentations: [
// getWebAutoInstrumentations initializes all the package.
// it's possible to configure each instrumentation if needed.
getWebAutoInstrumentations({
'@opentelemetry/instrumentation-fetch': {
// config can be added here for example
// we can initialize the instrumentation only for prod
// enabled: import.meta.env.PROD,
},
}),
],
});
ReactDOM.createRoot(document.getElementById('root') as HTMLElement).render(
<React.StrictMode>
<App />
</React.StrictMode>,
);
Let's add a fetch request on the button click to test the spans generated for fetch:
import { useState } from 'react';
import reactLogo from './assets/react.svg';
import viteLogo from '/vite.svg';
import './App.css';

function App() {
  const [count, setCount] = useState(0);


  const handleClick = () => {
    setCount(count + 1);
    fetch('https://api.publicapis.org/entries');
  };

  return (
    <>
      <div>
        <a href="https://vitejs.dev" target="_blank">
          <img src={viteLogo} className="logo" alt="Vite logo" />
        </a>
        <a href="https://react.dev" target="_blank">
          <img src={reactLogo} className="logo react" alt="React logo" />
        </a>
      </div>
      <h1>Vite + React</h1>
      <div className="card">
        <button onClick={handleClick}>count is {count}</button>
        <p>
          Edit <code>src/App.tsx</code> and save to test HMR
        </p>
      </div>
      <p className="read-the-docs">
        Click on the Vite and React logos to learn more
      </p>
    </>
  );
}

export default App;
To make sure that OpenTelemetry SDK generates some data open the dev console and check the data for document load, button click, and fetch.
Sending traces to OTEL collector
To send traces to an OpenTelemetry Collector, you need to configure and utilize an appropriate traces exporter. Here's an example of sending traces to an OpenTelemetry Collector from your application. We will use Jaeger for this example.
Step 1: Install Jaeger
Let's install an all-in-one docker version of Jaeger as described in docs.
docker run -d --name jaeger \
  -e COLLECTOR_ZIPKIN_HOST_PORT=:9411 \
  -e COLLECTOR_OTLP_ENABLED=true \
  -p 6831:6831/udp \
  -p 6832:6832/udp \
  -p 5778:5778 \
  -p 16686:16686 \
  -p 4317:4317 \
  -p 4318:4318 \
  -p 14250:14250 \
  -p 14268:14268 \
  -p 14269:14269 \
  -p 9411:9411 \
  jaegertracing/all-in-one:1.43
The collector is running on :4318 port (accept OpenTelemetry Protocol (OTLP) over HTTP, if enabled)
Step 2: CORS issue
You might need to make an additional setup for your exporter. From OpenTelemetry docs:
If your website and collector are hosted at a different origin, your browser might block the requests going out to your collector. You need to configure special headers for Cross-Origin Resource Sharing (CORS).
In this example, we use nginx reverse proxy as described here.
Step 3: Setup exporter-trace-otlp-proto in React application
Since we are ready to send traces, let's remove ConsoleSpanExporter and replace it with @opentelemetry/exporter-trace-otlp-proto. Also, we are replacing SimpleSpanProcessor with BatchSpanProcessor. From OpenTelemetry docs:
The BatchSpanProcessor processes spans in batches before they are exported. This is usually the right processor to use.npm install @opentelemetry/exporter-trace-otlp-protoimport React from 'react';
import ReactDOM from 'react-dom/client';
import App from './App.tsx';
import { Resource } from '@opentelemetry/resources';
import './index.css';
import { registerInstrumentations } from '@opentelemetry/instrumentation';
import { getWebAutoInstrumentations } from '@opentelemetry/auto-instrumentations-web';
import {
BatchSpanProcessor,
TracerConfig,
WebTracerProvider,
} from '@opentelemetry/sdk-trace-web';
import { ZoneContextManager } from '@opentelemetry/context-zone';
import { OTLPTraceExporter } from '@opentelemetry/exporter-trace-otlp-proto';
import { SemanticResourceAttributes } from '@opentelemetry/semantic-conventions';
const collectorOptions = {
url: 'http://localhost:8080/v1/traces', // <-- nginx with reverse proxy to http://localhost:4318/
};
const providerConfig: TracerConfig = {
resource: new Resource({
[SemanticResourceAttributes.SERVICE_NAME]: 'my-react-app',
}),
};
const provider = new WebTracerProvider(providerConfig);
provider.addSpanProcessor(
new BatchSpanProcessor(new OTLPTraceExporter(collectorOptions)),
);
provider.register({
contextManager: new ZoneContextManager(),
});
registerInstrumentations({
instrumentations: [getWebAutoInstrumentations()],
});
ReactDOM.createRoot(document.getElementById('root') as HTMLElement).render(
<React.StrictMode>
<App />
</React.StrictMode>,
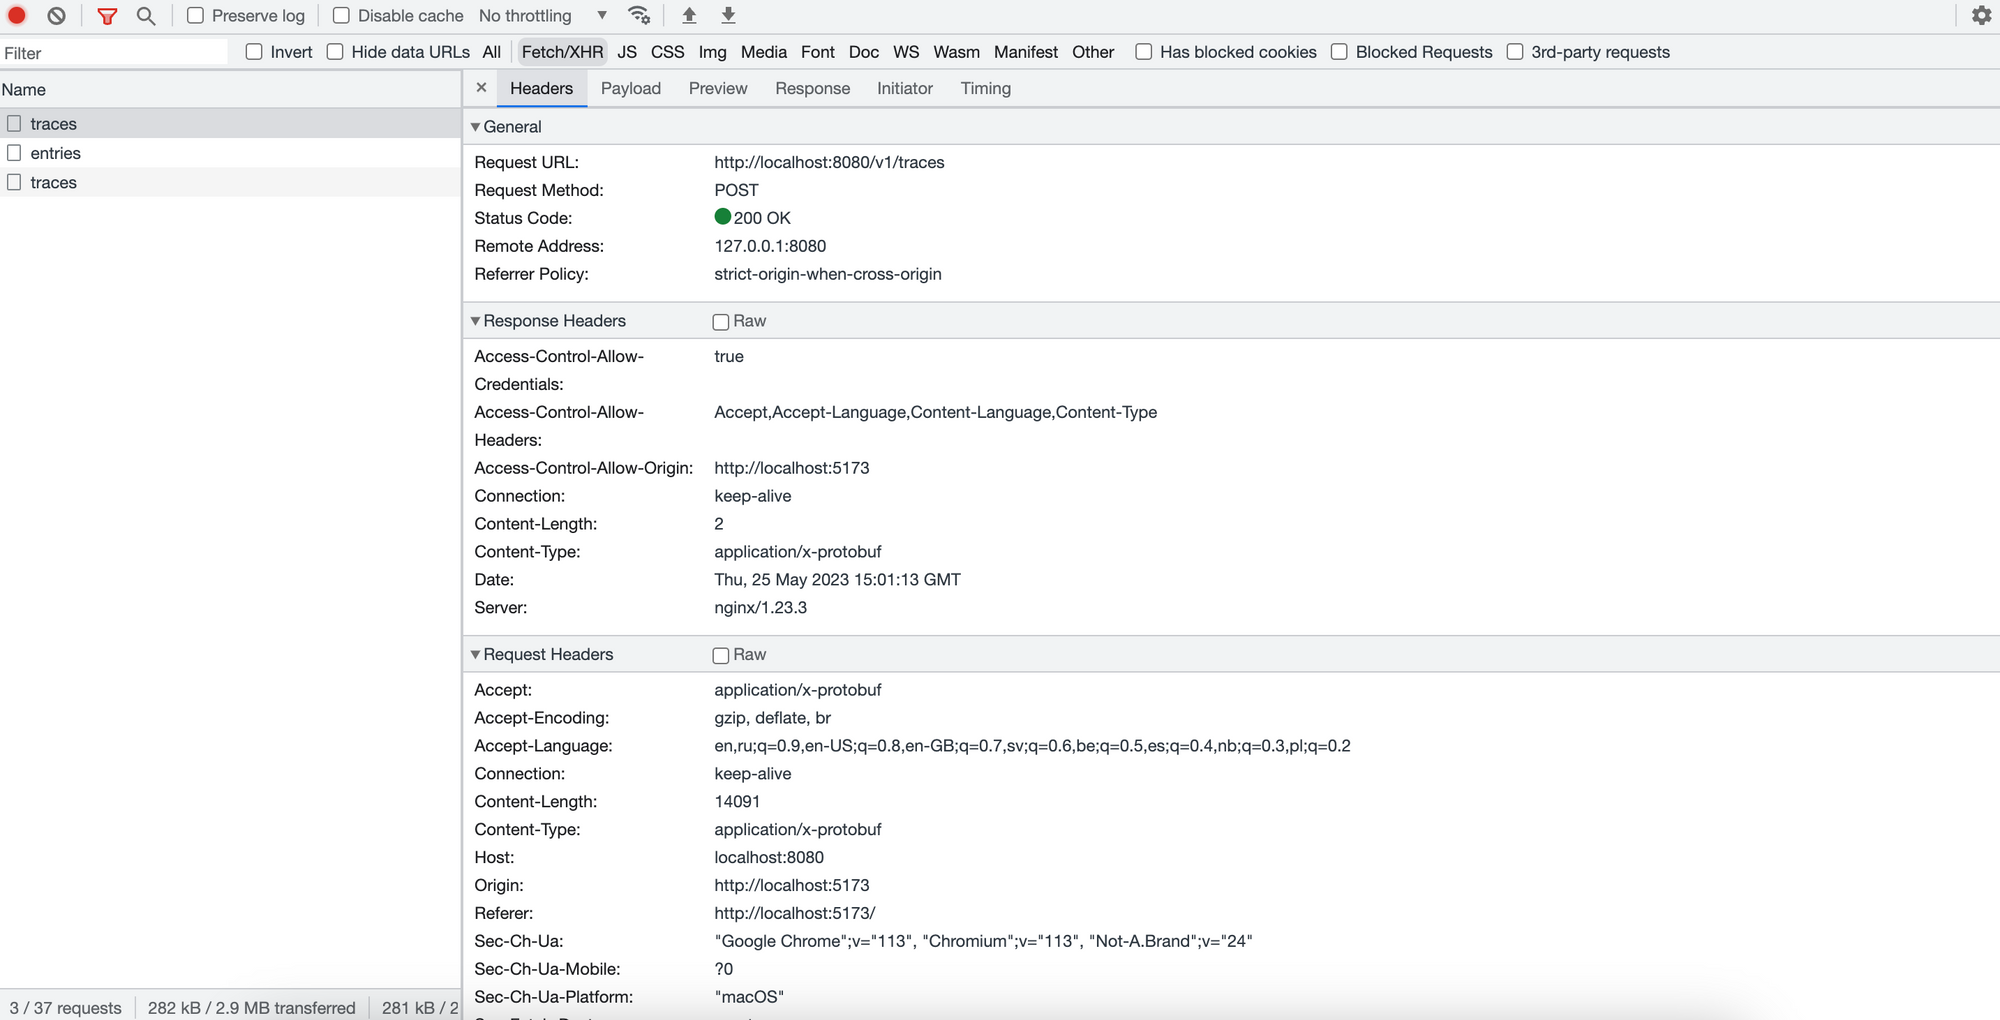
);Step 4: Make sure traces are sent
Open our sample React app to check if traces are being sent to the Jaeger collector.
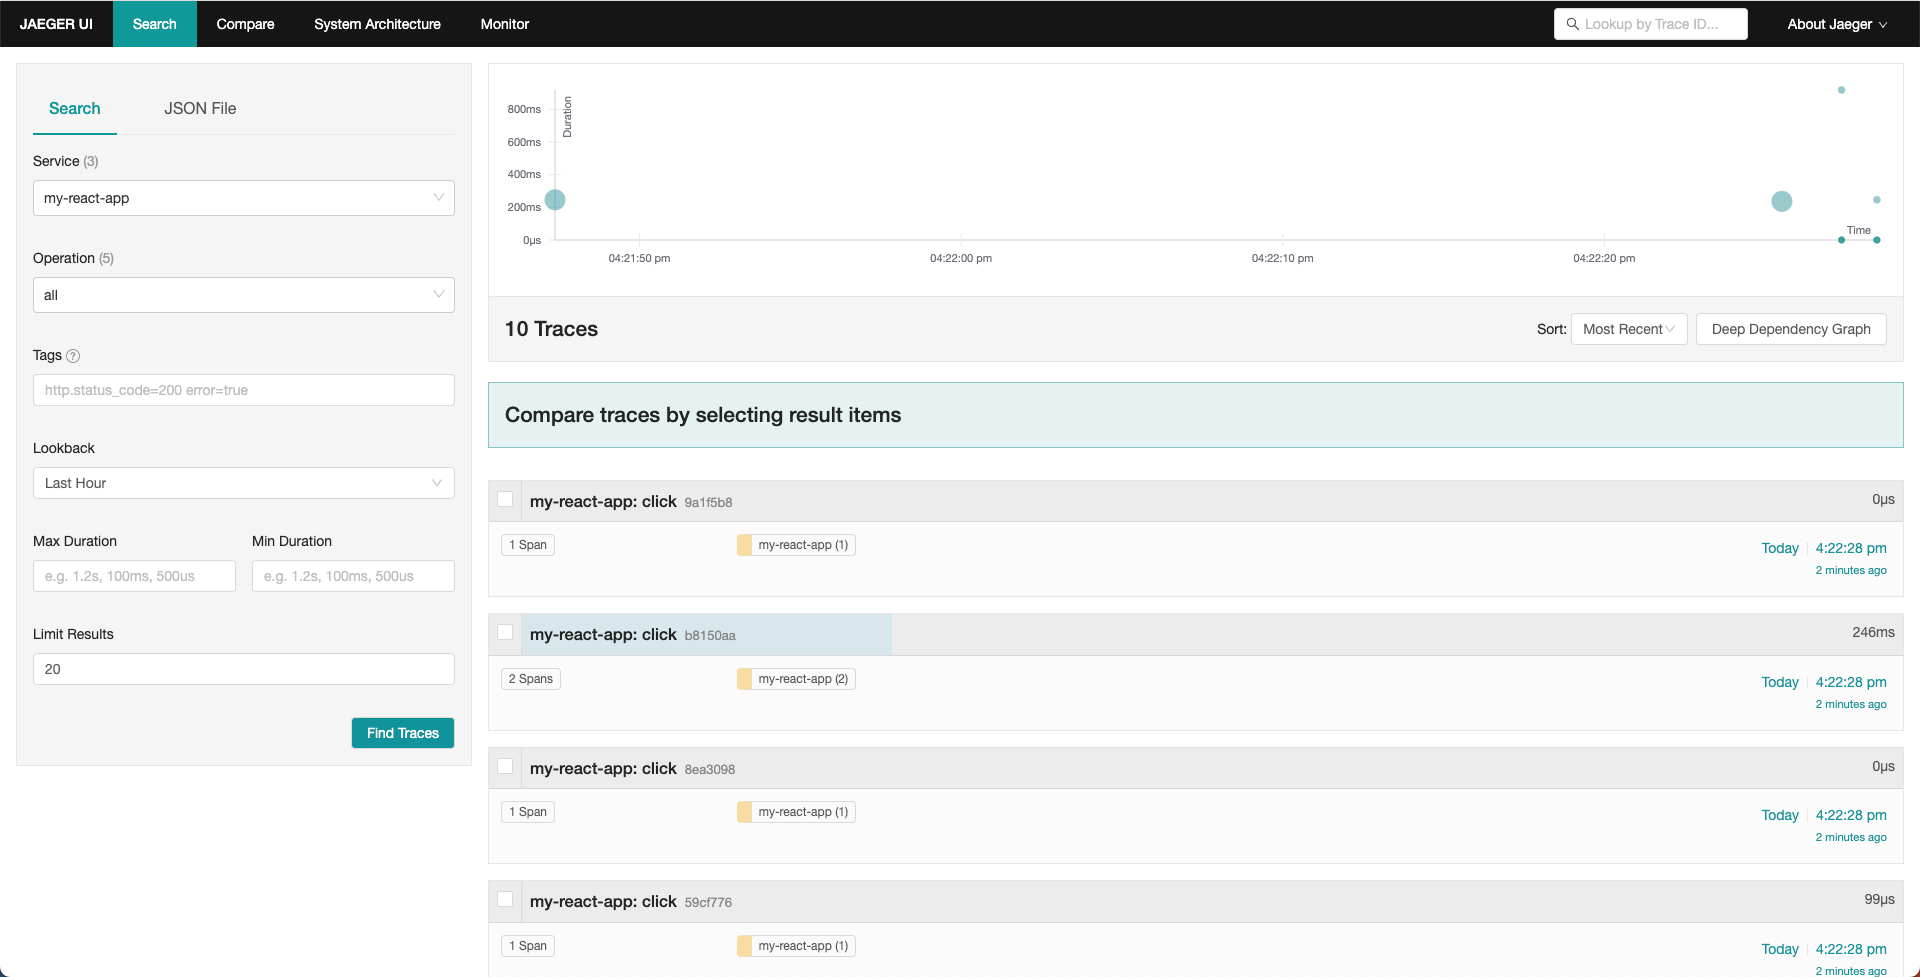
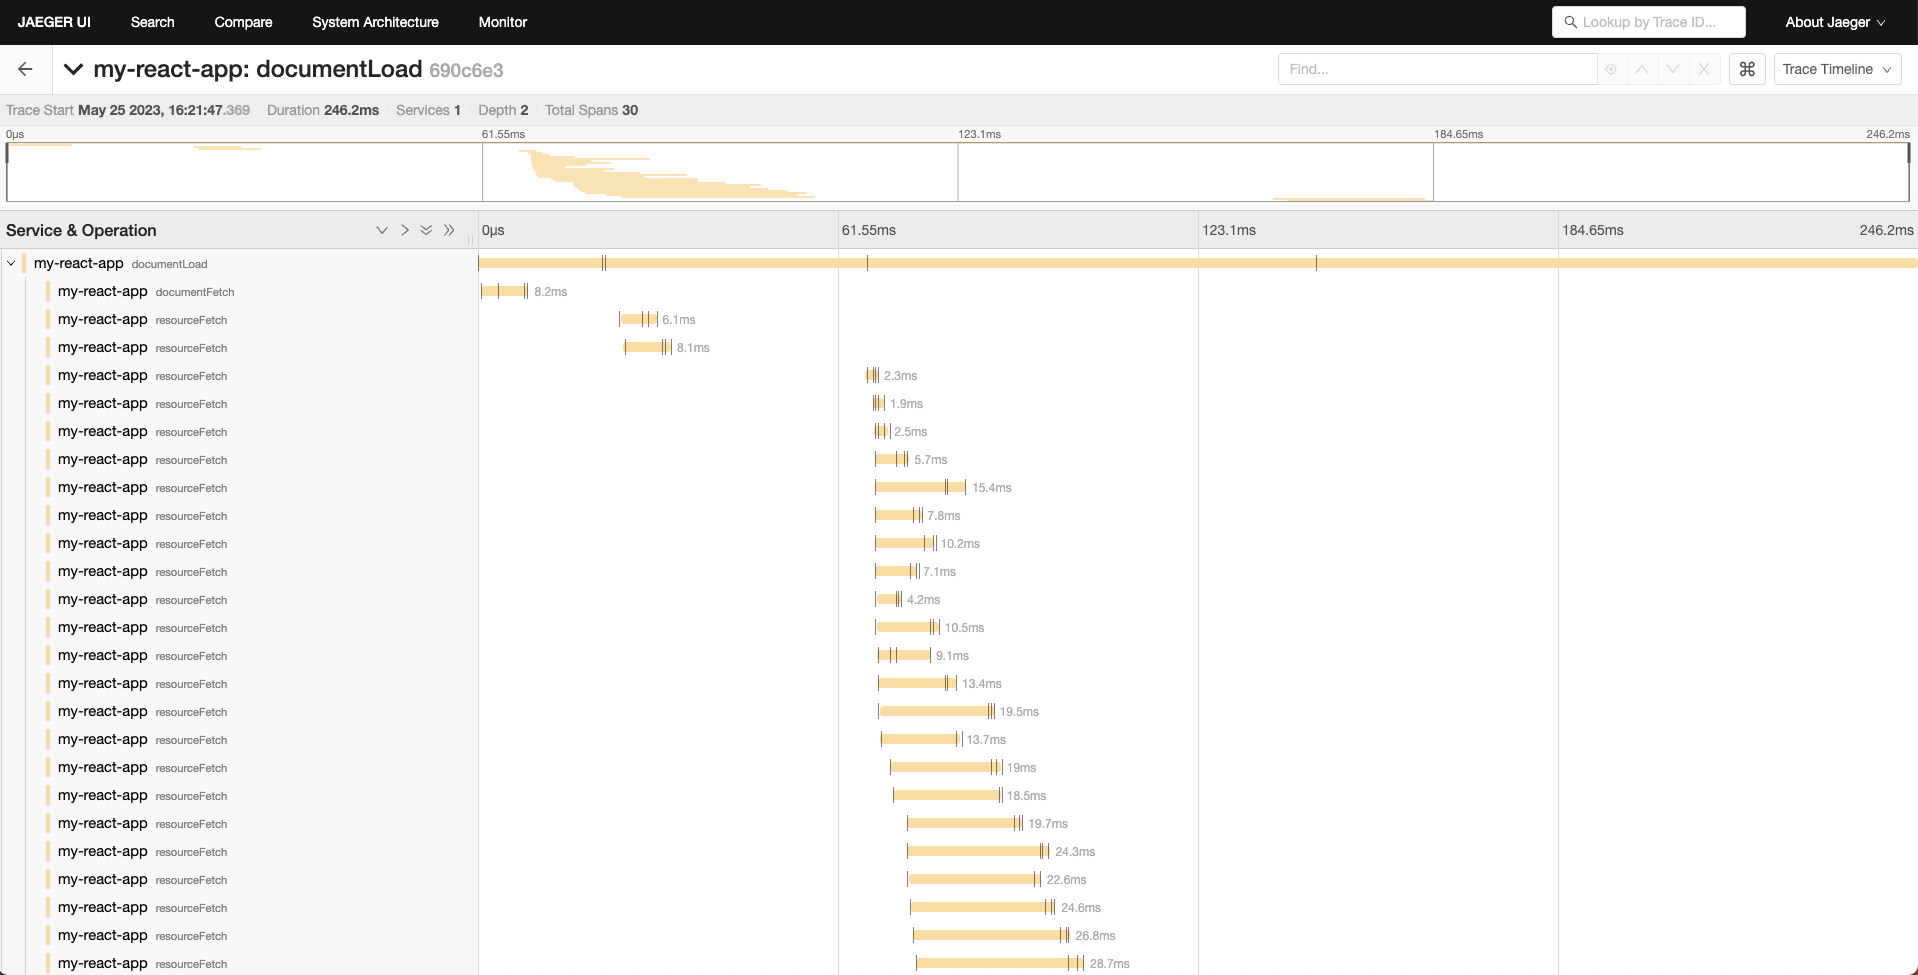
Step 4: Find traces in Jaeger UI
Open http://localhost:16686/ to check traces sent for my-react-app.
Conclusion
In conclusion, integrating OpenTelemetry into React applications offers numerous benefits for monitoring and observability. OpenTelemetry is a powerful open-source framework that provides a standardized way to capture, trace, and analyze application telemetry data. By incorporating OpenTelemetry into React applications, developers can gain valuable insights into their application's performance, troubleshoot issues effectively, and improve overall user experience.
One key advantage of using OpenTelemetry in React applications is its ability to capture and trace distributed transactions across different services and components. This capability allows developers to identify performance bottlenecks, understand the flow of data between various parts of the application, and optimize resource utilization.
Furthermore, OpenTelemetry's vendor-neutral and language-agnostic nature makes it highly adaptable and compatible with different monitoring and observability tools. This flexibility empowers developers to choose the best-suited tools for their specific needs and leverage the rich ecosystem of integrations provided by OpenTelemetry.
Another notable advantage of OpenTelemetry is its support for different telemetry data types, including logs, metrics, and traces. This comprehensive approach enables developers to gather a holistic view of their application's behavior and performance, facilitating better decision-making and proactive issue resolution.
Moreover, the community-driven nature of OpenTelemetry fosters collaboration and innovation. With a large and active community of developers, it is continuously evolving and improving, incorporating new features and addressing emerging challenges. This ensures that React application developers have access to the latest monitoring and observability capabilities, keeping their applications in line with industry best practices.
However, it's important to note that implementing OpenTelemetry in React applications requires careful consideration and planning. Developers should identify the key metrics and traces they need to capture, ensure efficient resource utilization, and strike a balance between the level of detail and performance overhead.
In summary, OpenTelemetry is a valuable tool for monitoring and observability in React applications. By leveraging its capabilities, developers can gain deep insights into their application's performance, diagnose issues effectively, and deliver a better user experience. Embracing OpenTelemetry empowers developers to build more reliable, scalable, and maintainable React applications in today's dynamic and complex software environments.