Flexible Entity Model for Prometheus Metrics

Metrics and Entities
When a monitoring tool collects performance metrics, it usually records the measurement as well as its metadata information. For example, a container CPU usage metric also reports the container name, the node name, instance type, and perhaps the application service to which the container belongs. This context information also provides the dimensions by which we can aggregate our data. Once we have the CPU usage for one container, we can get the total CPU usage for the whole node or the average CPU usage for the entire service.
To build a fully-fledged observability product, it's usually a good idea to abstract the context into a set of entities. On top of this entity layer, we can provide a more sophisticated user experience for system navigation, alerting, troubleshooting, and integration. So how do we decide what are the entities we need to have?
Traditionally, a monitoring system came with a pre-defined entity model that fits whatever the mainstream technology stack was at the time. The entity model usually included applications, services, nodes, and perhaps containers if they came out in the container age. This model is often hierarchical, so metrics are collected at the lowest level like containers but can automatically aggregate up to higher levels like services.
Inevitably our tech stack evolves, and new concepts come out. We now have Kafka topics, Kinesis streams, API gateways, Lambdas, etc., not to mention Kubernetes, which introduced an array of new concepts. Retrofitting these new concepts into an old entity model can be challenging. Hence our monitoring systems begin to fall behind, and their value diminishes.
Using Prometheus
Prometheus does not try to impose an opinionated model on the metrics. Similar to how Kubernetes tags all the resources, it simply tags metrics with labels. Take the following metric from the cAdvisor as an example:
container_cpu_usage_seconds_total{container="api-server", cpu="total", endpoint="https-metrics", id="d5cce093ad5", image="asserts/api-server.dev@sha256:00bf", instance="10.8.84.201:10250", job="kubelet", metrics_path="/metrics/cadvisor", namespace="asserts", node="ip-10-8-84-201.us-west-2.compute.internal", pod="api-server-855b7c9874-q5cxp", service="kube-prometheus-stack-kubelet"} 204It is a Prometheus counter that counts the number of CPU seconds a container uses. In addition to the value of 204, we also have the container’s name/id/image, the node name/IP, the pod name, the Kubernetes namespace, etc.
Labels can encode rich context information, and their relationships can form a graph instead of a mere hierarchy. The schema on these labels can be a bit chaotic, though, as the open source community publishes Prometheus metrics for many different components, and each of them has its own set of labels.
Working with these raw metrics takes some serious effort. You will need to master the PromQL query language and understand the meaning of each label published by various exporters. More importantly, you don't have an intuitive way to navigate across your system topology. For typical correlation analysis, you may need to write a super complex PromQL query or run many of them to get a sense of what's going on. Such a laborious process is often a burden in a troubleshooting situation.
Using Prometheus with Asserts
Asserts is a tool to help you better utilize your Prometheus metrics. Asserts automatically surfaces vital signals from your raw metrics to reduce the mental effort needed for all the domain knowledge. In addition, unlike traditional monitoring tools, Asserts also discovers various entities based on your metrics and builds a searchable and easy-to-navigate entity graph for your system. We have a set of pre-defined entities, but the discovery process is easily customizable, so the time series data decides your entity model, not the other way around. This way, the entity model improves the usability of the monitoring solution but does not stand in the way for the user to extend and customize how they use Asserts.
Let’s look at an unconventional example. Many cloud services do not publish Prometheus metrics out-of-box, but there are 3rd-party components that we can leverage to parse the source data and export metrics in Prometheus format. There are solutions like aws-cloudwatch-exporter for Cloudwatch and span-metrics-processor for Open Telemetry spans. In the case of Apigee, an API management framework, we can even leverage grok-exporter to parse logs and publish metrics. As you can imagine, such processes can be highly customized, so we cannot expect a pre-defined schema.
apigee_request_total{api="billing",gateway="commerce",operation="getBill",path="/billing",service="PaymentService"} 165.0
apigee_request_total{api="product",gateway="commerce",operation="getProduct",path="/product",service="CatalogService"} 163.0
apigee_api_response_time_hist_count{api="billing",gateway="commerce",operation="getBill",path="/billing",service="PaymentService"} 162.0
apigee_api_response_time_hist_count{api="product",gateway="commerce",operation="getProduct",path="/product",service="CatalogService"} 76.0
apigee_api_response_time_hist_count{api="product",gateway="commerce",operation="getPromotion",path="/product",service="PromotionService"} 18.0
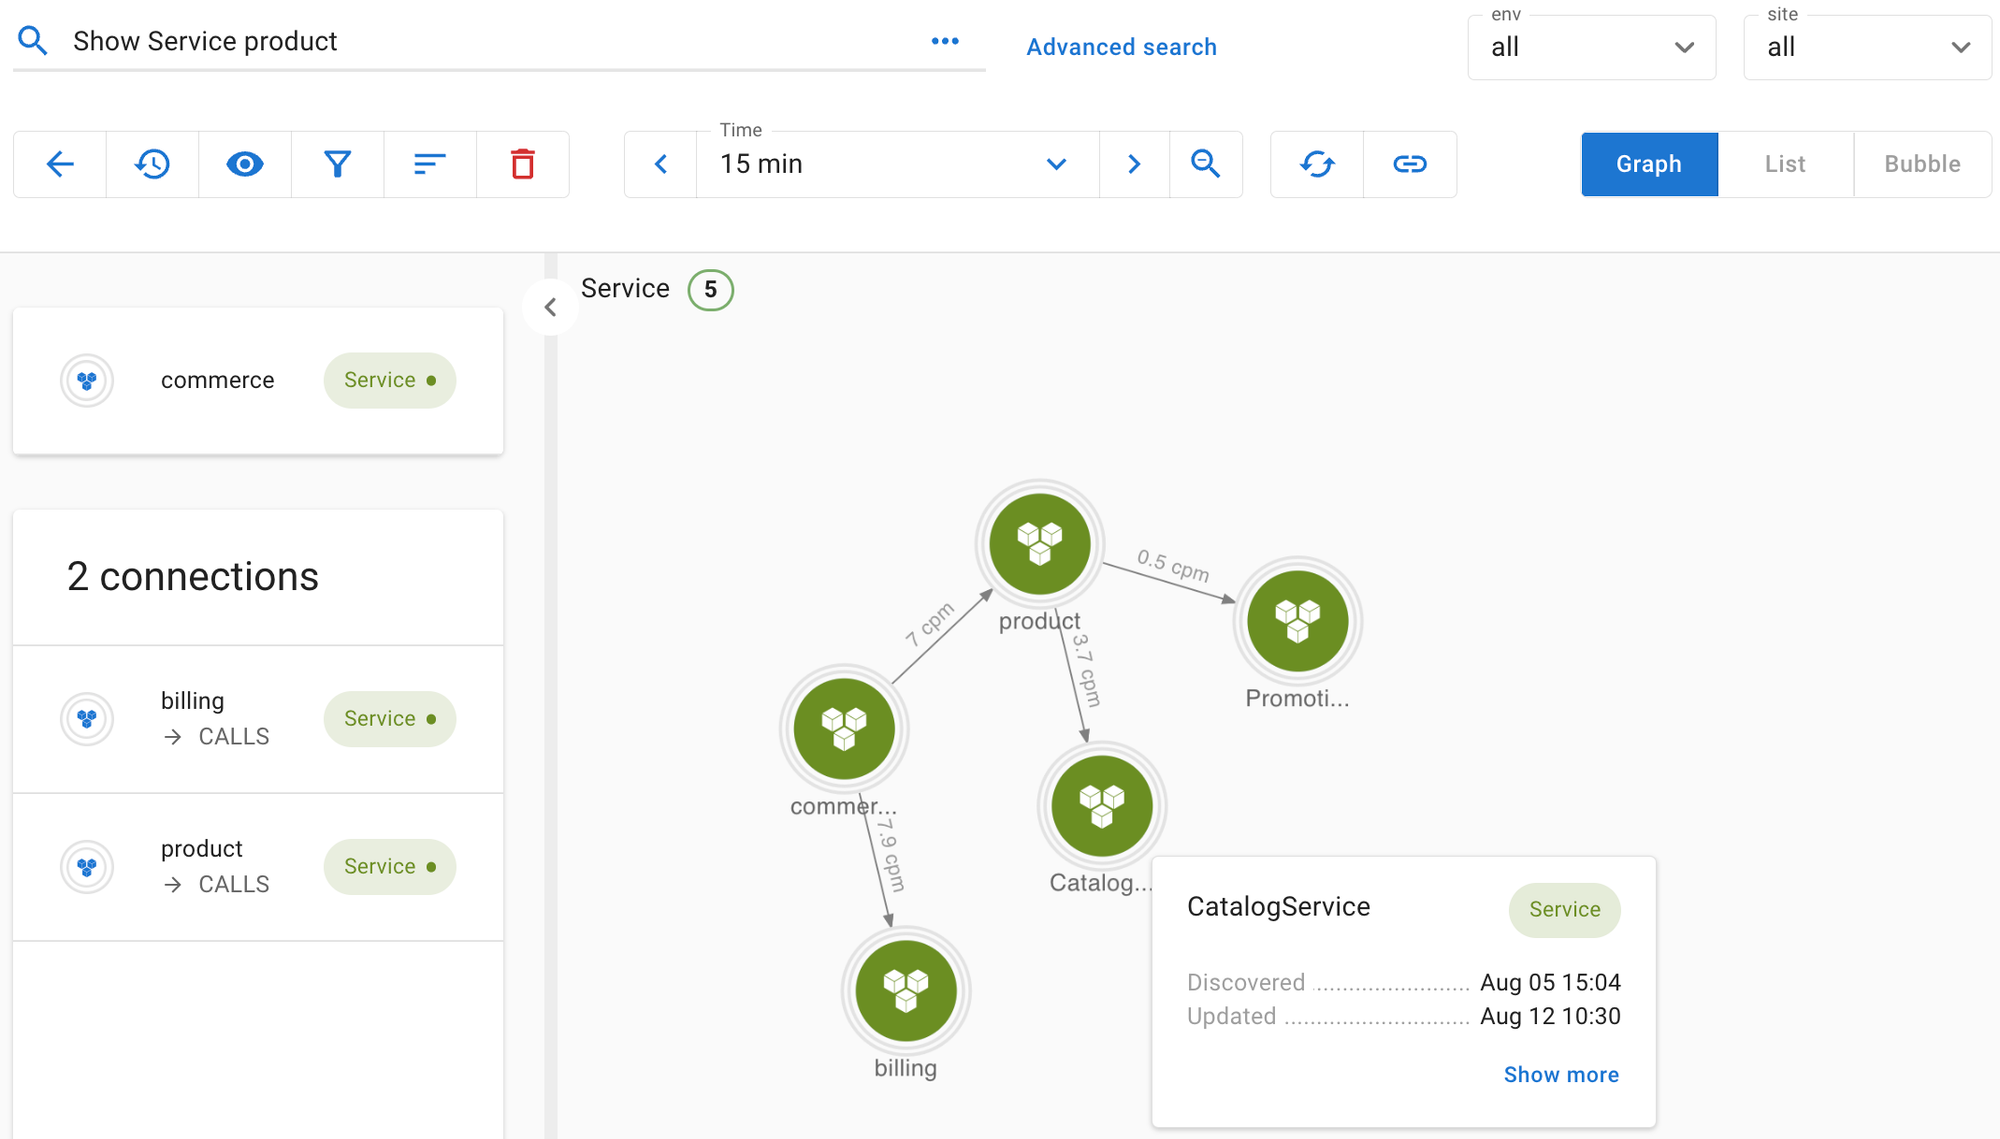
...In this example, gateway is the name of the top-level apigee site, which has two API endpoints, billing and product. Each of the API endpoints routes traffic to one or more target services. PaymentService handles the getBill operation. CatalogService and PromotionService work together to handle the getProduct operation.
These metrics encode all three layers in their labels. It's like a monolithic metric representation, even though the underlying system is a micro-service layout. Imagine you have dozens of proxies and target services. How do you quickly identify which subsystem is having performance issues and what adjacent components may be contributing to or being impacted by the problem?
Asserts’ entity discovery process can help here. Because a few simple rules specify the process, we can be flexible in how we interpret the system. We could treat commerce as a single entity and associate all the metrics to it, or as a better alternative, we can break it down into three layers of services. By changing a few lines, we can easily extract labels that identify the three layers, i.e., gateway, api, and service, and use them to construct a service graph.
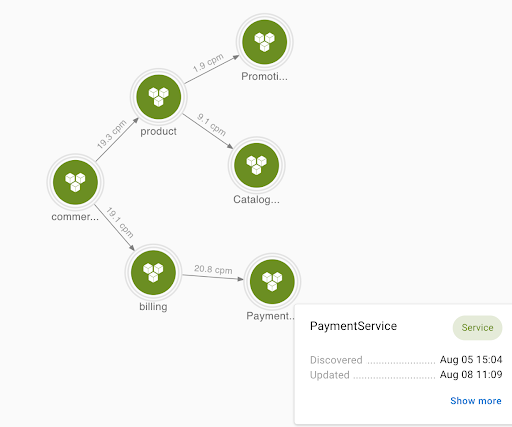
In this case, each service will have its separate dashboard and assertions sourced from your chosen slice-and-dice of the monolithic metrics. This model is much more accessible for the users to navigate and analyze each subsystem's health. In addition, Asserts' assertion visualization and workbench tool can surface them quickly if there are correlations between two subsystems.
This is just one example of how flexible Asserts' entity model is. If you are interested in learning more, you are more than welcome to check out our documentation and request a free trial today.