Announcing Asserts

We’re excited to announce Asserts -- a metric intelligence and observability platform. By scanning your app's metrics in any Prometheus compatible time-series database (TSDB), Asserts intelligently discovers a real-time map of your app and infrastructure architecture, builds dashboards, tracks service level objectives (SLOs), and runs automated checks (Assertions) to surface changes and potential problems. We strive to reduce alert fatigue and time to the root cause.
What is Asserts?
Asserts makes it super easy and fast to get to the bottom of app and infra problems -- even for highly scaled and complex architectures. You’ll get alerts for the key metrics your users care about the most. You’ll know right away when something important breaks and you won’t waste time sorting through less relevant or false alarms.
In addition to most relevant alerts, Asserts will show you everything you need to solve the issue – failures that might be causing the problem, related changes, and anomalies – all in one place. Based on Prometheus, Asserts works with any app and any architecture. You just need key metrics to get started.
Why is monitoring hard?
Our team at Asserts has lived the life of monitoring at AppDynamics. Customers of AppDynamics relied on our SaaS platform to monitor their own apps, so fixing our production outages quickly was paramount. We needed to get to the bottom of problems as quickly as possible.
When we built cloud-native apps at AppDynamics, we learned how hard it was to monitor apps effectively, even with the state-of-the-art APM tools with logs, metrics, traces, dashboards, and alerts, at our disposal. We faced the difficult trade-off that we've all experienced -- configuring high-level alerts vs. fine-grained alerts.
When we set up alerts on a few high-level business or user experience metrics e.g., Records Processed, PageRenderTime, APIAvailability, we had more reliable alerting but then troubleshooting became lengthy and error-prone.
However, when we configured fine-grained alerting, e.g., CPU Load, JVM GC, Request Timeouts, alerts were noisy and often fired on trivial issues when there was no user-visible problem. Waking up at 3 am for an alert is no fun, especially for a false alarm.
Finding the needle in the haystack
Our troubleshooting sessions consist of going through numerous dashboards and metrics and searching for a specific root cause of the problem -- the classic needle in the haystack. We asked ourselves: how could this process be automated?
To avoid alert fatigue, we need to configure alerts at the high level on app or business metrics so that alerts are focused on the potential symptoms of problems. In addition, we need a way to automatically identify the root cause of problems to expedite troubleshooting. While these automated checks are somewhat similar to alerts, they are different since they won’t wake you up when they fire. These checks are troubleshooting aids and not the first line of defense against outages. We call them Assertions.
Removing the toil
Every app is different, so Asserts makes it easy for you to set up your own Assertions and service level objectives (SLOs). Throughout our in-depth industry experience, we noticed that apps share a large number of common problems. For example
- resource saturation, whether it’s a disk filling up or a cloud service exceeding its provisioned capacity
- rolling out a new version or a config update triggering an increased latency
- a gradual accumulation of errors causing your SLOs to breach
We’ve built a whole library of Assertions you can easily utilize to find problems in your apps. Our assertion library is built around a taxonomy called SAAFE which helps you navigate problems your app is facing.
When you have Assertions identifying the root cause of problems, you don’t need to be an expert on every part of your app’s architecture. Tribal knowledge, such as what changed; which metrics to look at; what’s normal and what’s not; is now accessible to every person on your team.
To understand the relationship between symptom and cause, you also need to understand the architecture of your app: a failure in one component often causes problems in another. When troubleshooting with metrics and dashboards alone, you need to build a model of these interconnections on the fly. Asserts automatically learns the architecture of your app based on your metrics and creates a visualization for you so that you can focus on fixing the problems faster.
Solving a problem
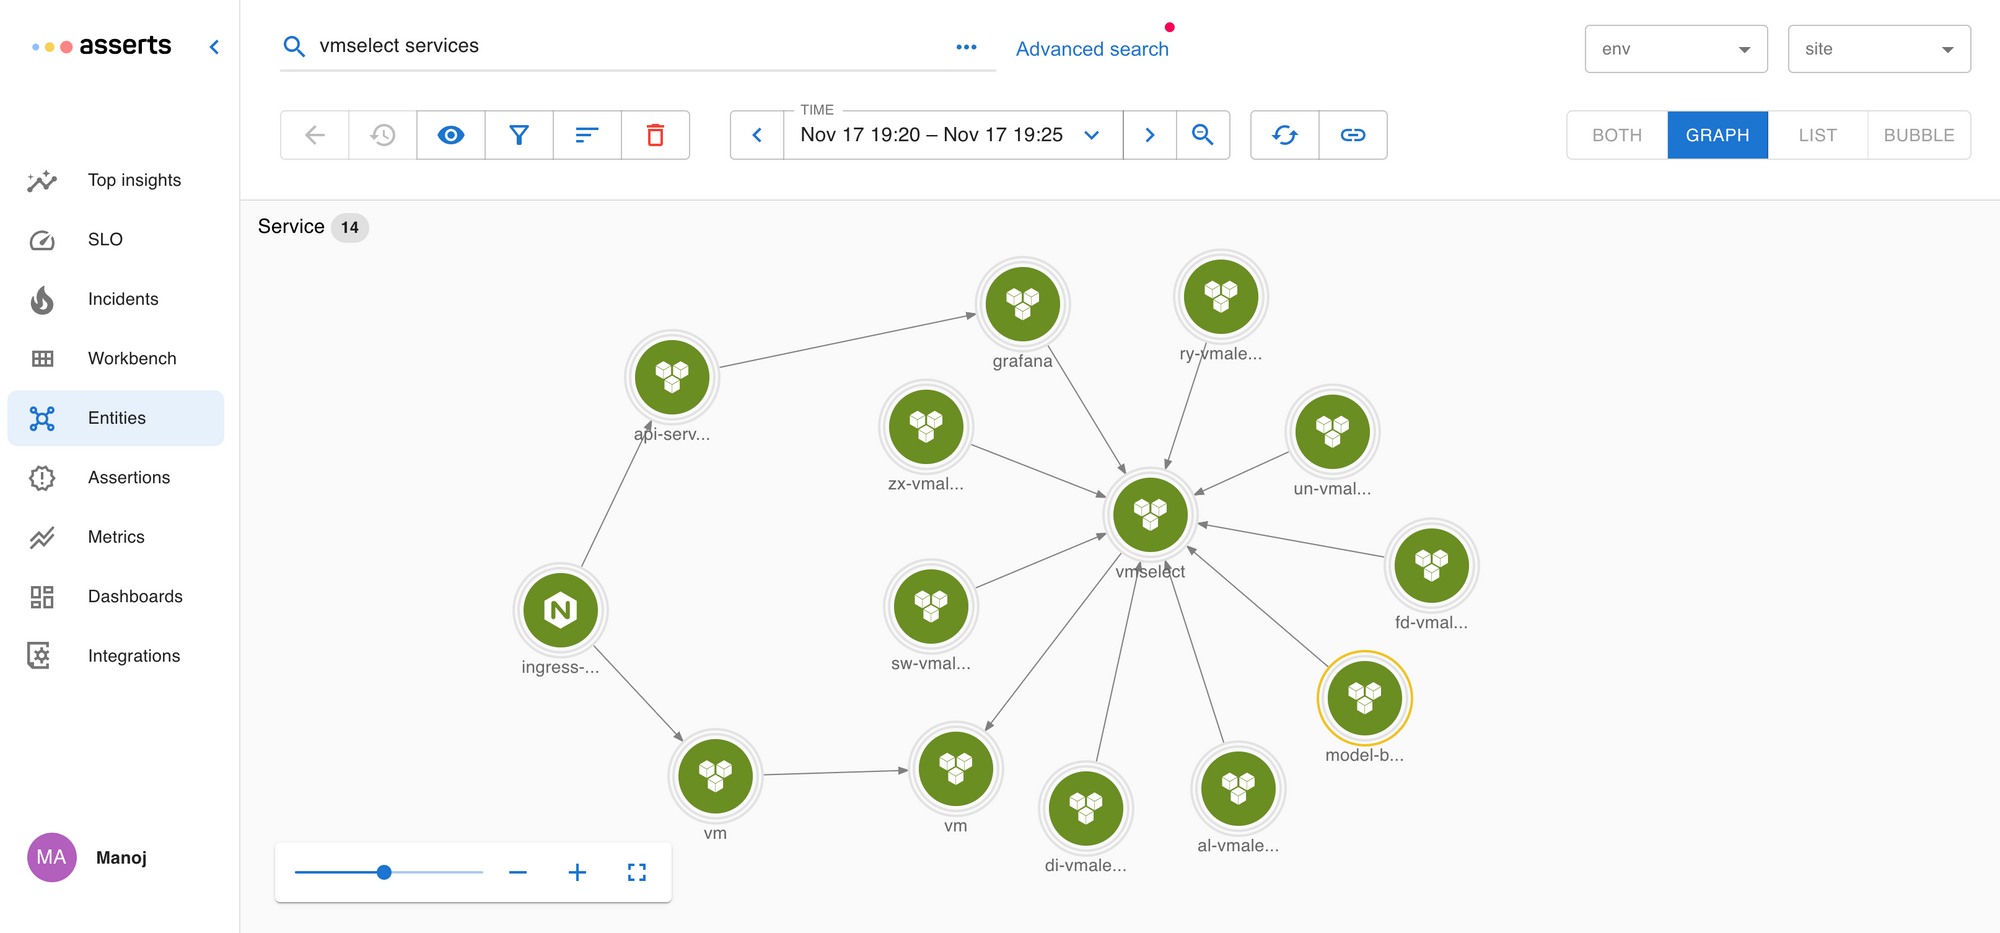
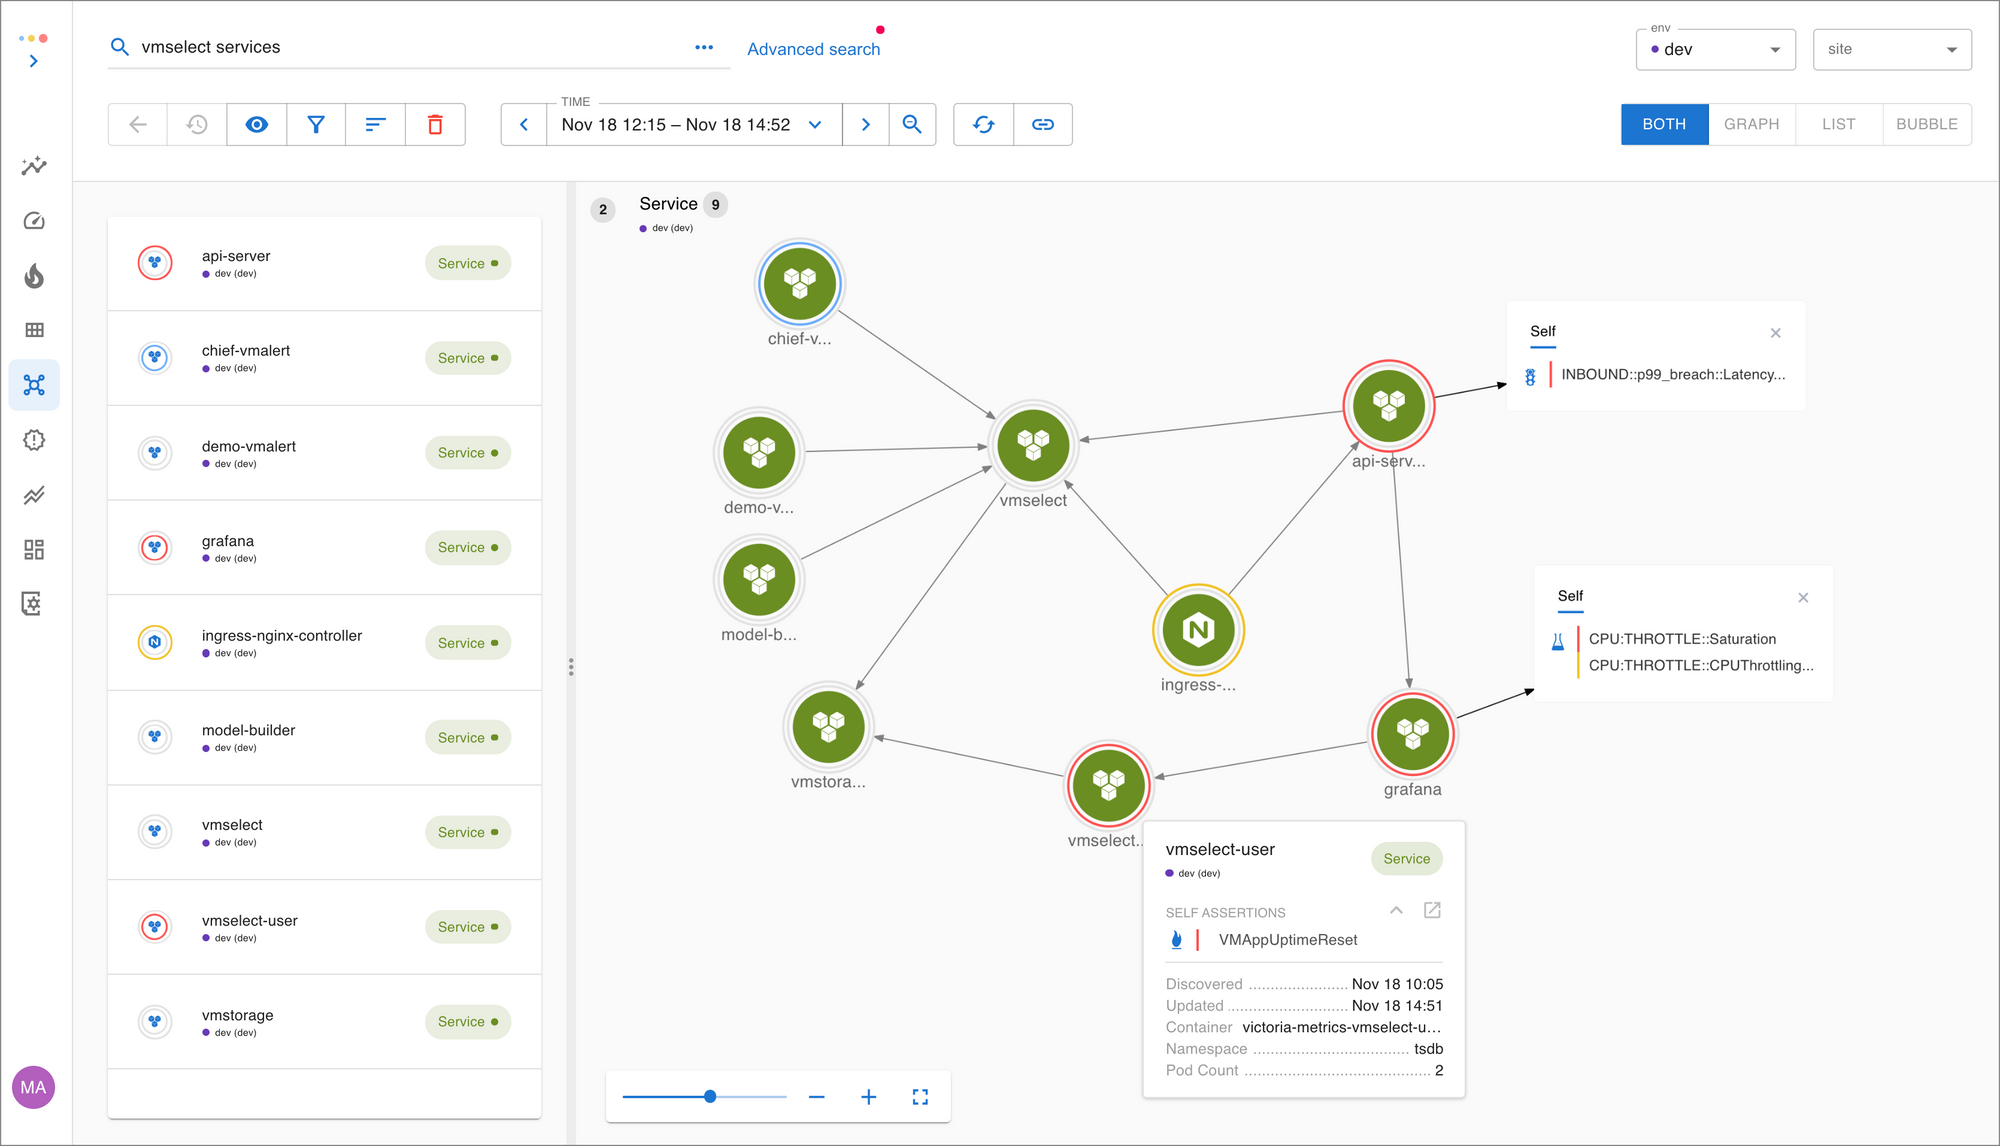
Let’s illustrate through an example in which we drink our own Kool-Aid and use Asserts to solve problems in our own app. A quick note on our app architecture: we run a time series database that consists of a few services. vmselect is responsible for running queries, vmalert evaluates rules (queries). grafana and other Asserts services also route their queries to vmselect.
See the architecture for vmselect and connected services in Asserts entity graph.
To monitor our app, we’ve set up service level objectives to track its performance. We realized something was wrong when Asserts sent us an alert pointing out that our API-server latency was slow and our ability to evaluate recording rules for our customers was degraded.
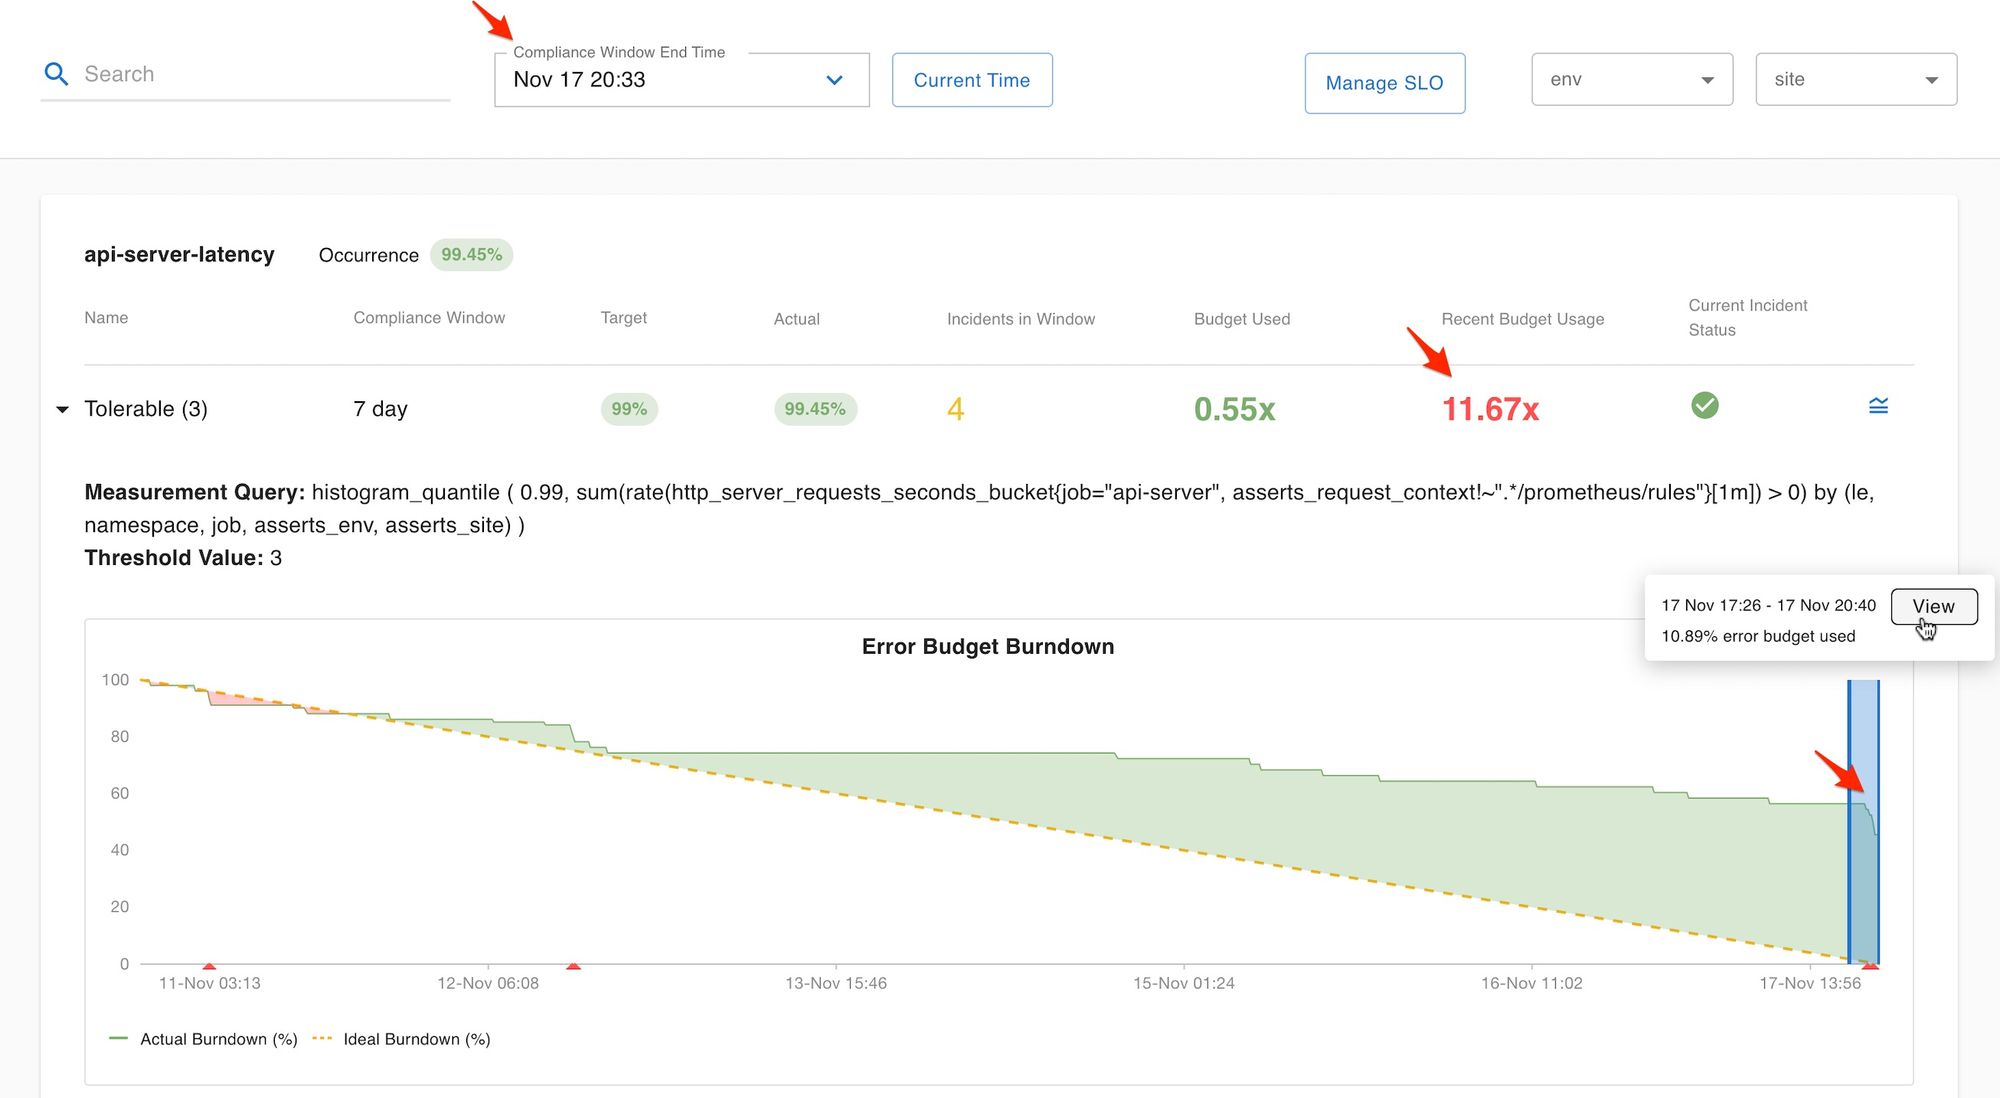
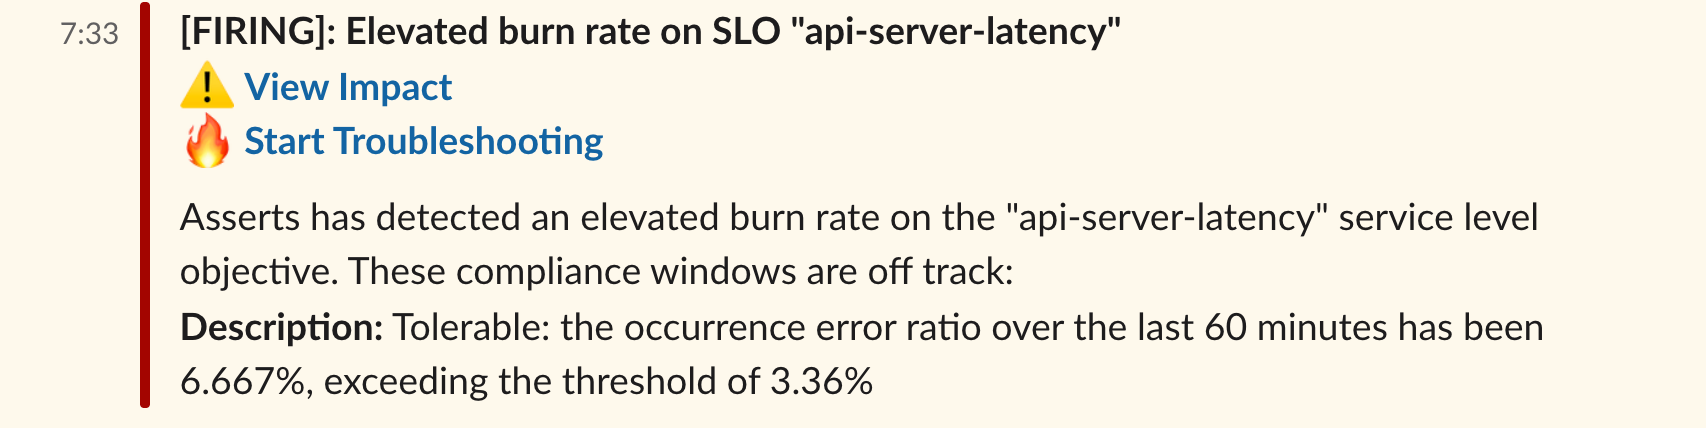
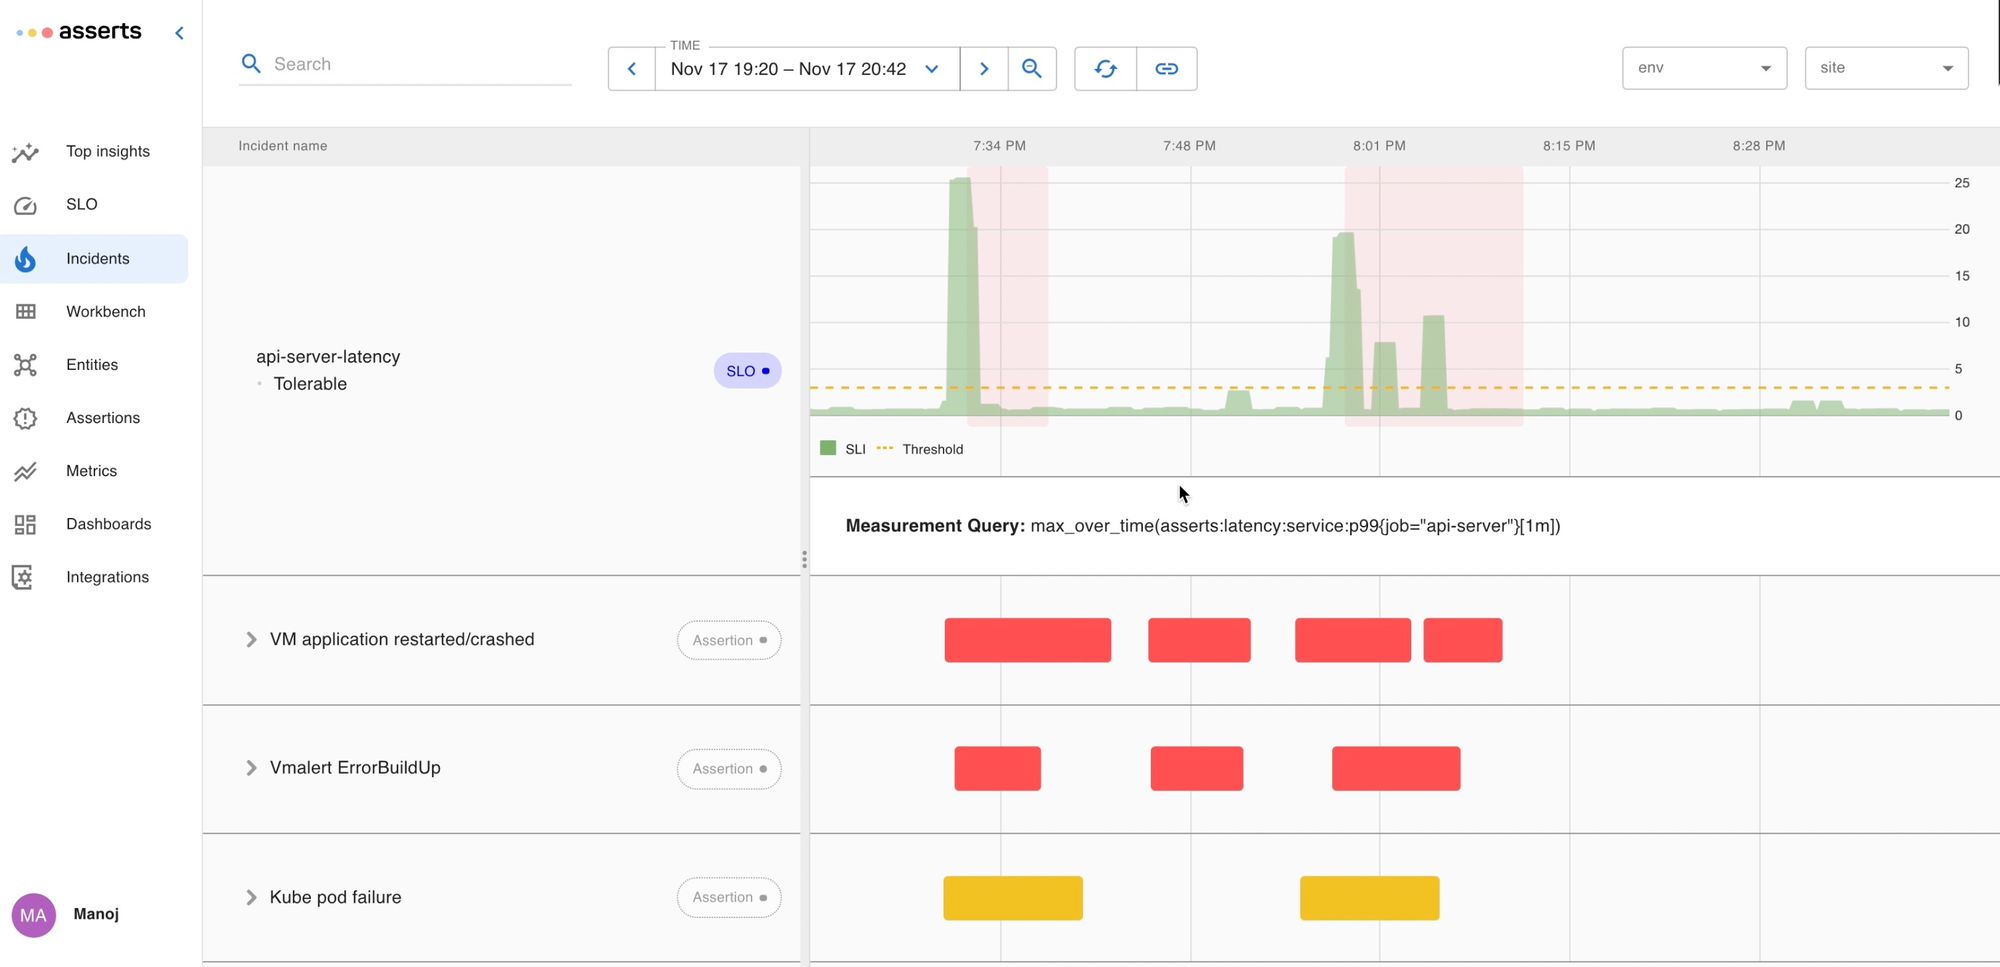
The alert has a convenient View Impact and Start Troubleshooting link embedded in it to assist in the troubleshooting process. The View Impact link shows the incidents of interest around the time of the alert.
See below, around the same time the api-server was experiencing latency issues we can see that vmservice (on which api-server depends on for running the timeseries queries) had crashed too:
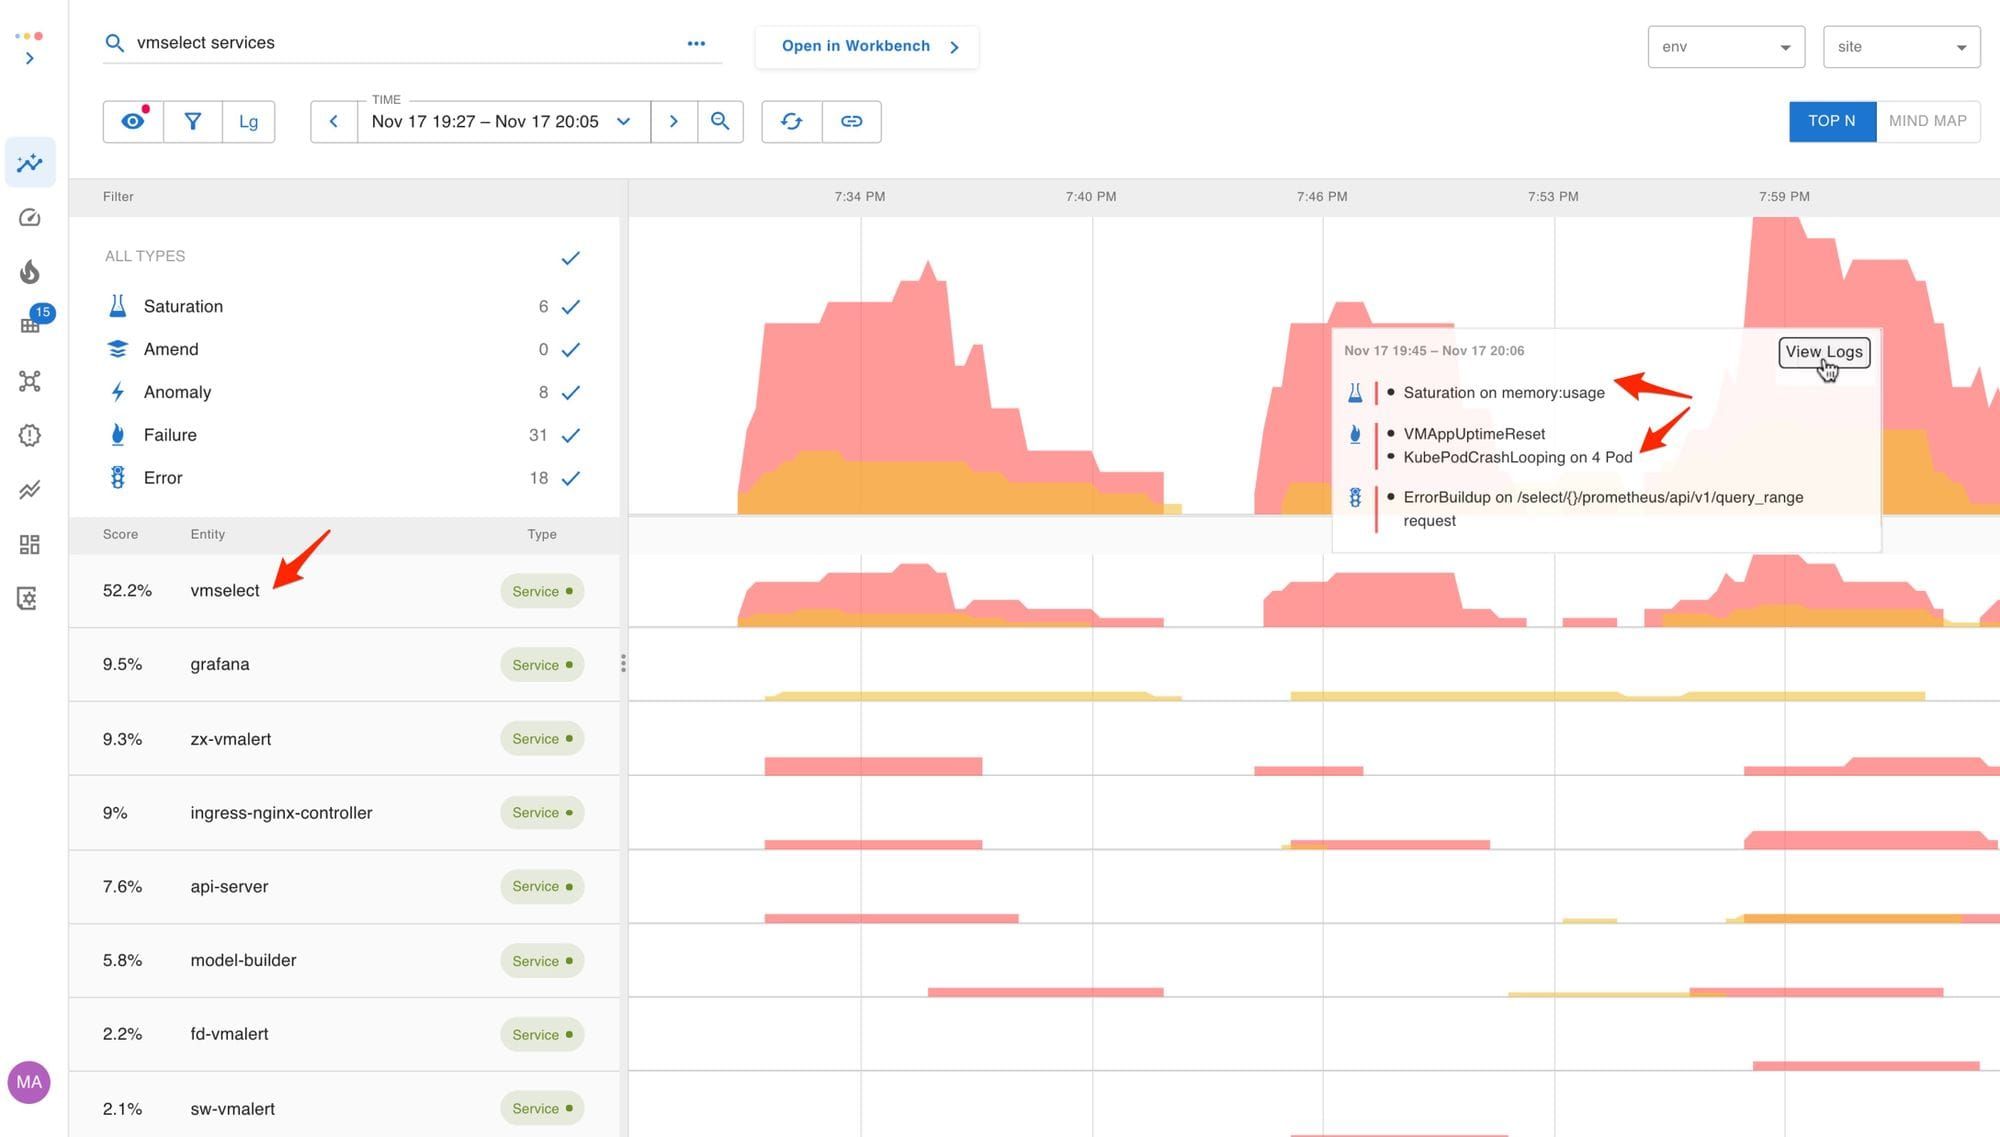
The Start Troubleshooting link launched the Top Insights screen. Here we rank services by their weighted assertion score to surface the hot spot in the system so a user can jump right in. Assertions are denoted by blue (changes/amends), yellow (warning), and red (critical) color.
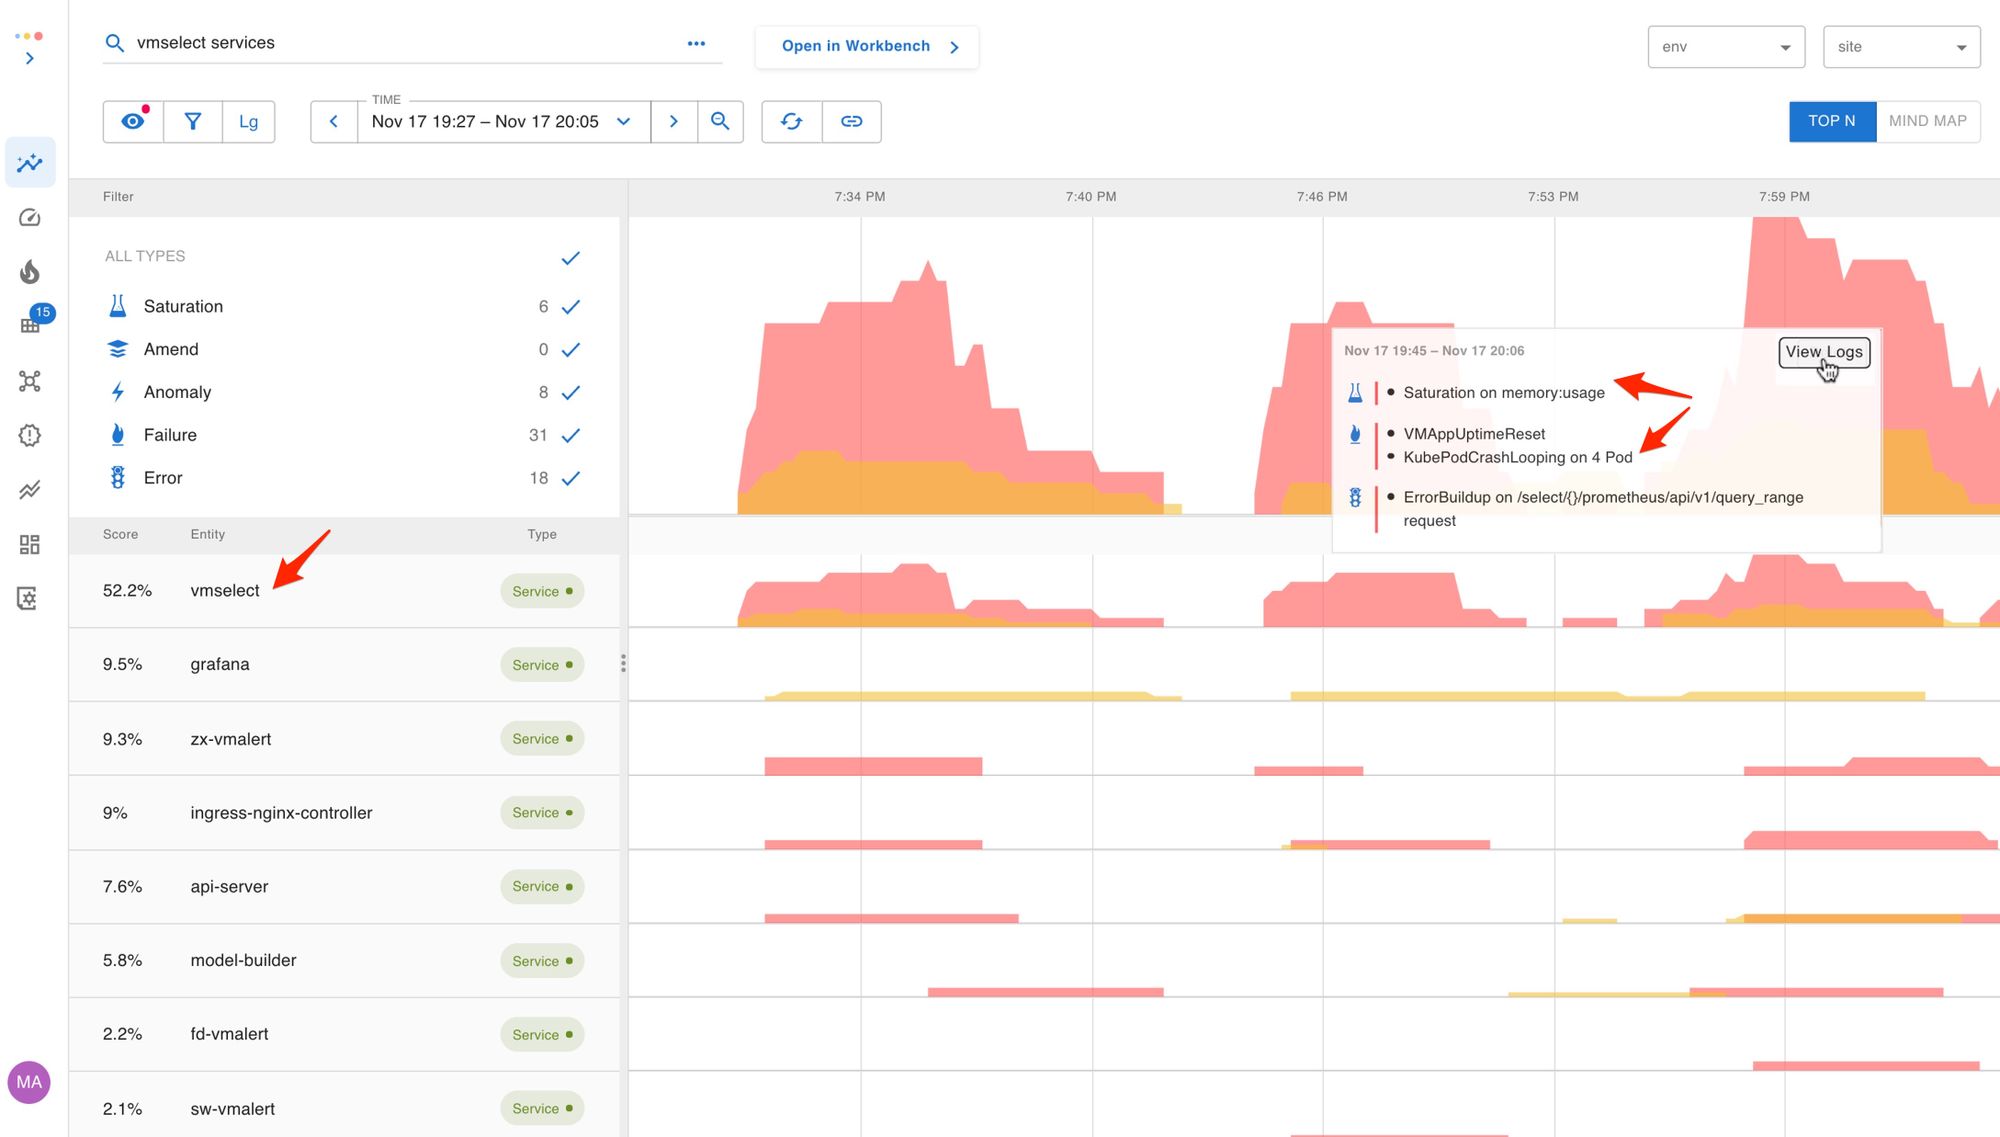
vmselect is having the most problems, so it has risen to the top.The failing assertions showed the vmselect service had crashed and become unavailable due to memory saturation.
Notice that there were no blue lines (Amends) before the incident started, which is Asserts way of saying that there were no updates to rules (queries) or builds on any of the services.
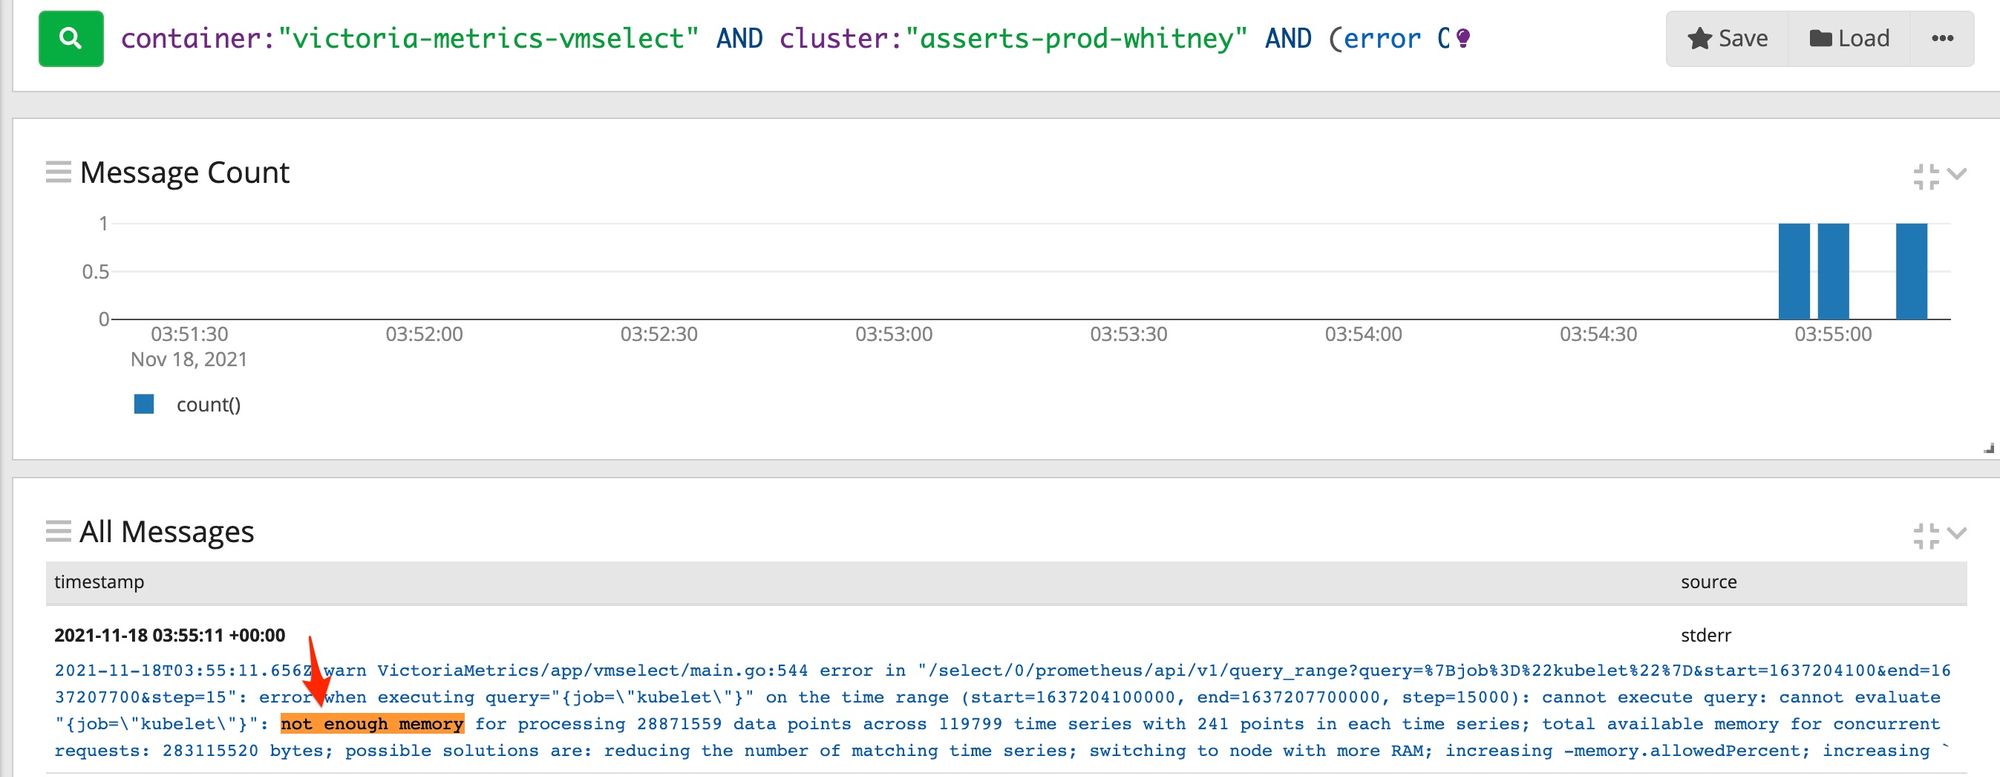
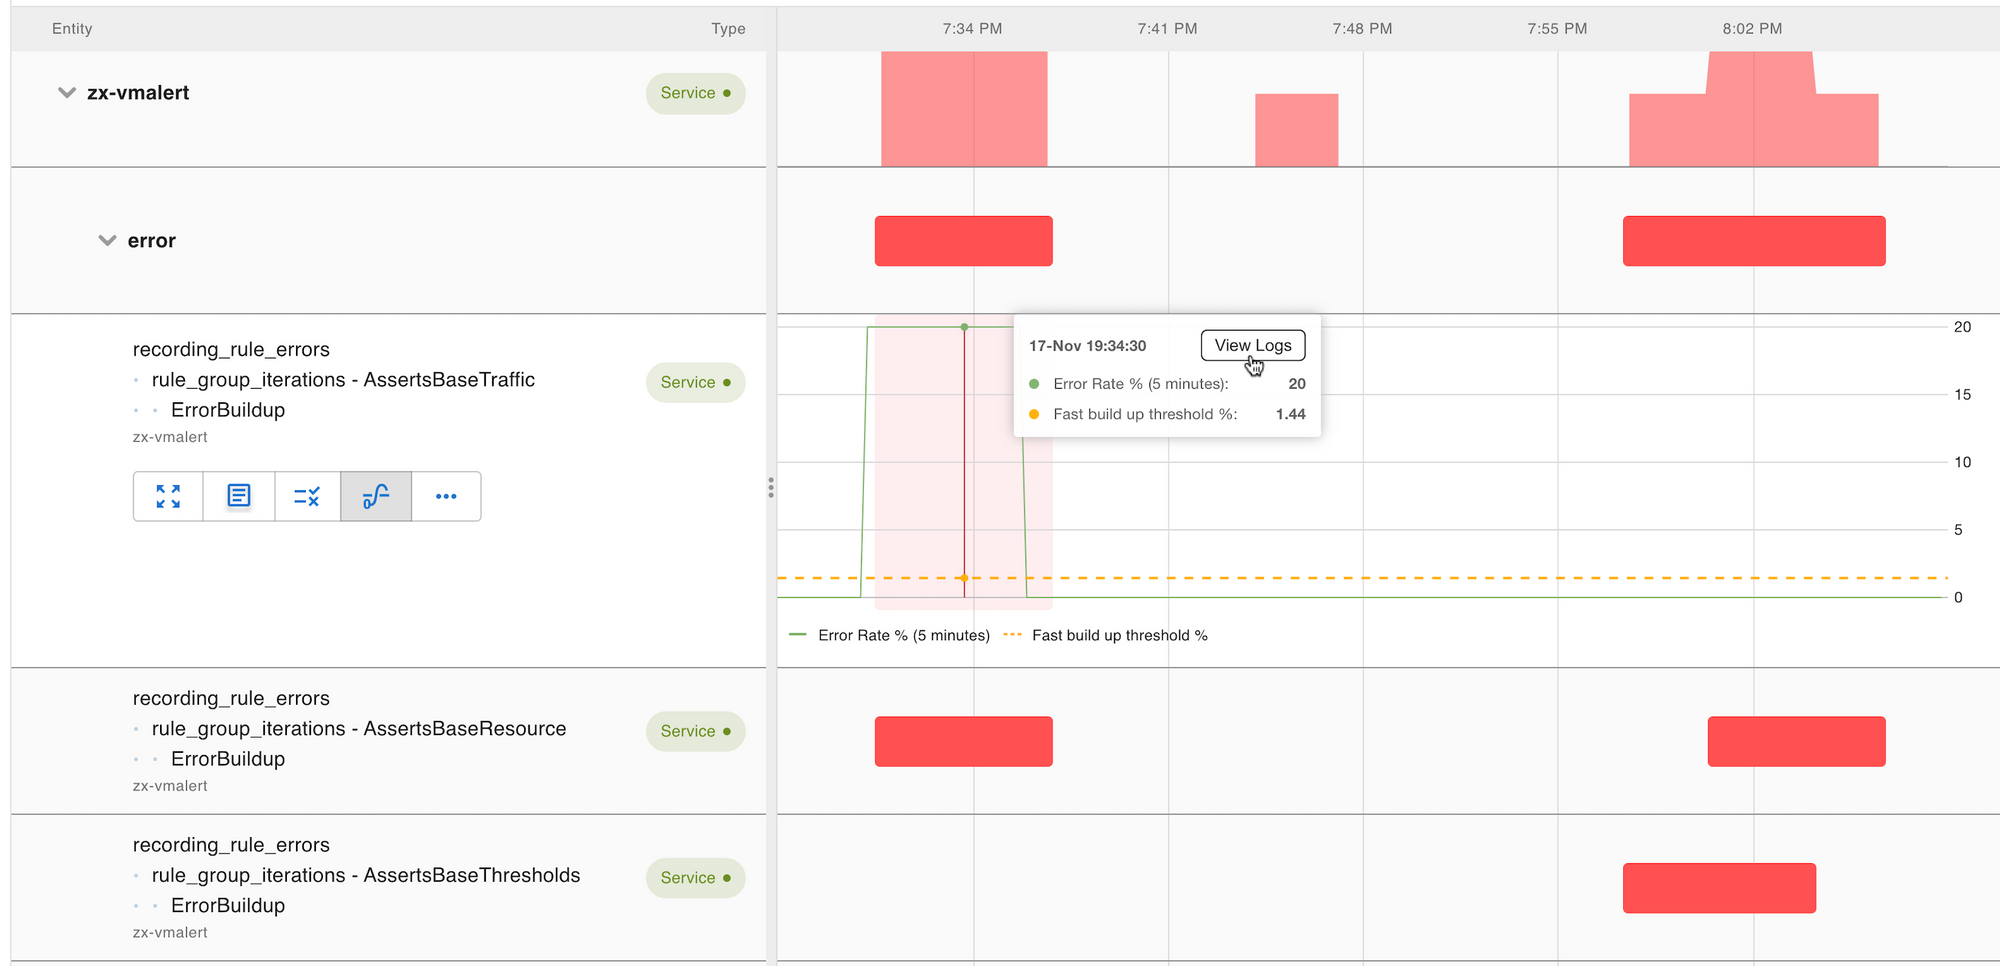
A glance at the logs launched from View Logs showed an error: vmselect ran out of memory while executing a query.
We wanted to know:
- Where the bad query came from
- How our customers were impacted
- How we could prevent this problem from happening again
To answer these questions, we started digging into the assertions firing on other services.
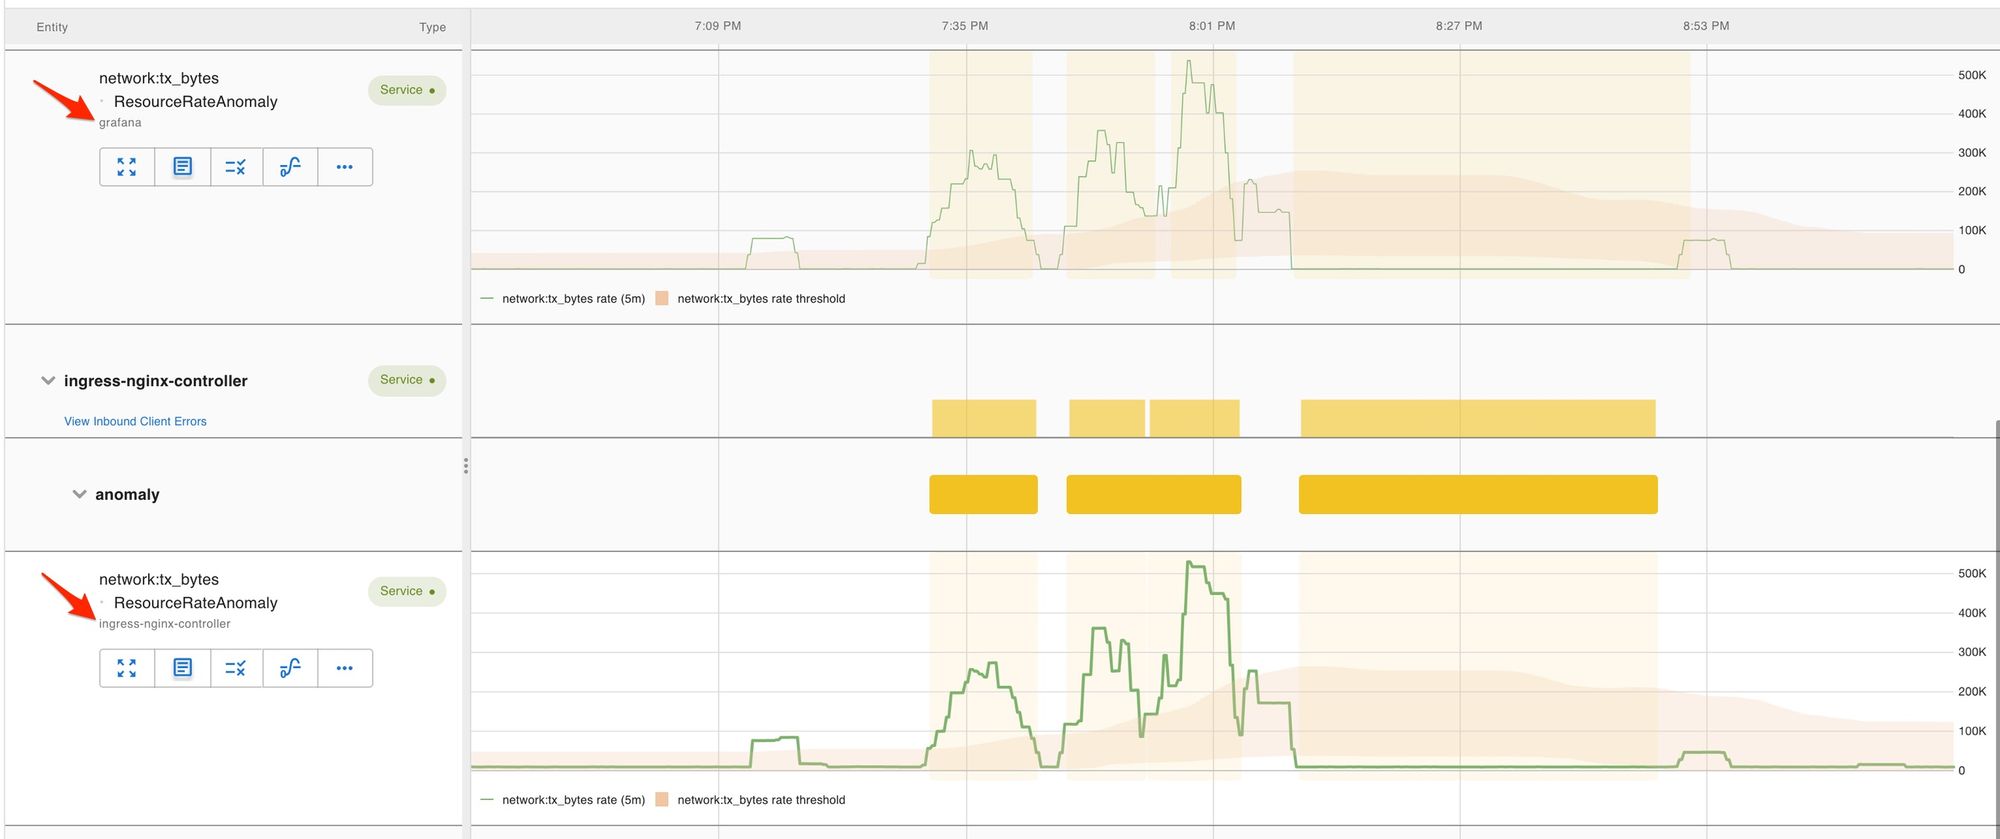
See video summarizing how Asserts records assertions and presents an aggregated view of assertions with filtering and drill-down capabilities to narrow down on the problematic entity and metric.
When Assertions fire, they are denoted by yellow and red lines on this timeline. vmselect is having the most problems so it has risen to the top.
The Assertions surfaced anomalous network usage during this time: there was an unusual amount of traffic between Grafana and our ingress controller that routes traffic from our browser frontend to the backend services. This was positive evidence that someone must have been evaluating particularly heavy queries via grafana query interface.
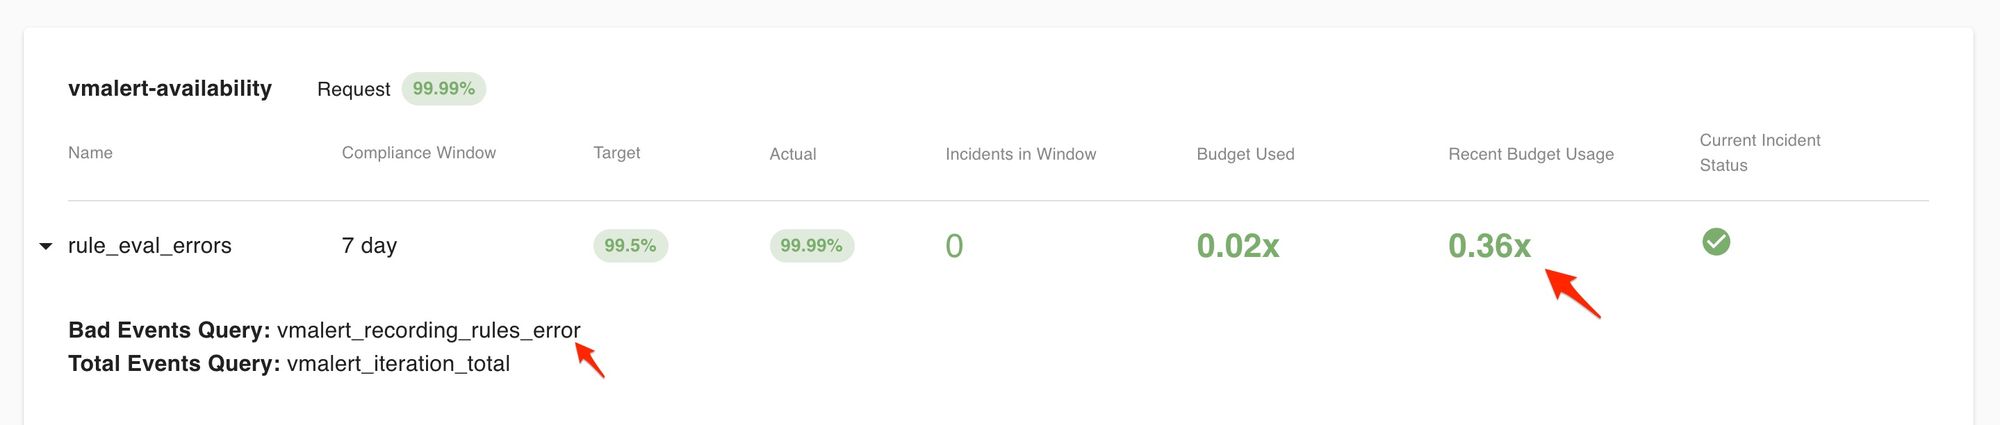
Drilling into assertions from other services, we also noticed that during the outage a number of our vmalert instances were throwing errors. This means rule evaluations failed while the query layer of the time-series database, vmselectwas down. Since we run separate vmalert instances for each customer, we knew which customers and rule groups had been impacted and which had not. (Note the customer names are redacted in these screenshots).
The root of the problem became clear. A user fired a series of queries and executed it via grafana that required too much memory to evaluate, and crashed the query service vmselect. This blocked the rule evaluation for some customers. To solve the immediate problem, we spun up more vmselect pods to improve the resiliency of the system.
See the video on how we identified the crashings pods and their memory usage just before the crash.
The pods reached their memory limits just before they crashed, degrading the vmselect service’s availability until new pods were added.
Troubleshooting without Asserts
Before we solve the problem, let’s pause to consider how this situation would be different without Asserts. The standard tools for troubleshooting with metrics are dashboards and ad hoc exploration via PromQL. When we first received the alert at the beginning of the incident, we would have consulted a pre-built dashboard to help us find the problem quickly. For the dashboard to get us to the root cause, we would have needed to anticipate this sort of problem and added all the relevant metrics. In practice, this is difficult, so teams usually start with a minimal or generic dashboard and evolve it as they learn more about the operation of their apps. The first problem with dashboards as troubleshooting tools is they often are incomplete since it takes time to build this expertise. With Asserts, we have a library of reusable Assertions to draw from, so we start with a much richer baseline.
Secondly, when troubleshooting with a dashboard you need to scan through it, deciding whether any particular metric is worthy of further investigation while you hunt for the root cause. If the dashboard is large, this process becomes quite laborious so the dashboard must include only the most important metrics. Commonly, dashboards are incomplete and result in even slower ad hoc exploration. When troubleshooting with Asserts you start by looking at potential problems which results in a much shorter list. Once we’ve constrained our search to the most relevant metrics, troubleshooting is much faster.
Fixing the problem
But how do we prevent this from happening in the future? Since we don’t want to block users from running ad hoc queries but it’s also hard to predict their resource consumption ahead of time, we decoupled ad hoc queries from alert rule evaluation by running multiple deployments of vmselect.
Alert rule evaluation now has dedicated vmselect instances so alerts are reliably delivered. All queries from dashboards and users are serviced by vmselect-userand the worst thing that can happen when a user writes an expensive query is they'll need to refine it further before seeing the results.
vmselect deployments: the original vmselect that’s responsible for alerts, the vmselect-user which handles ad hoc queries.Asserts will simplify your troubleshooting workflow and remove the everyday toil in building and managing dashboards & alerts. We'd love to help get you up and running. All it takes is a few minutes to find insights!
- Manoj (Founder & CEO)