Serverless Monitoring with Prometheus and Asserts

AWS Lambda
AWS Lambda allows you to write functions and run them as a scalable service. It supports popular languages and runtimes like JavaScript/NodeJS, Python, Go and Java. It allows an event-driven model wherein Lambda functions are invoked in response to events, e.g., requests to an API Gateway, messages from an SQS Queue, or changes in DynamoDB or S3. AWS Lambda enables a pay-as-you-use model. You don’t have to pay for the idle time of your servers.
An example - Online Shopping Cart Checkout as Lambda
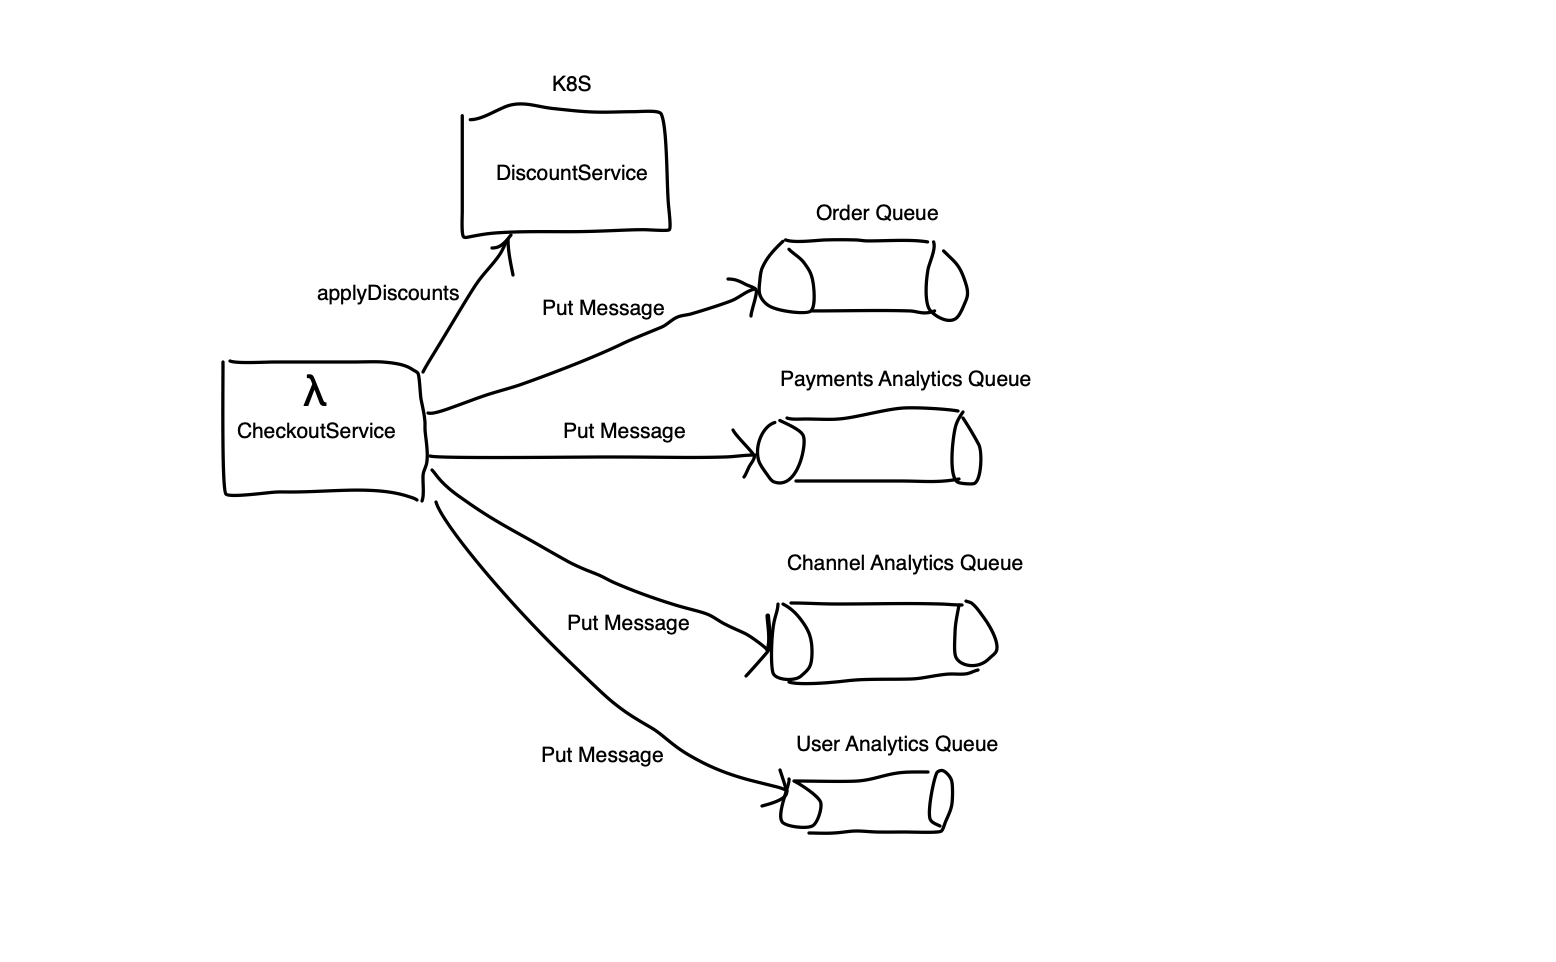
Let’s take the example of an online shopping cart where the checkout is implemented as a Lambda function invoked through an API Gateway. We also have a DiscountService that’s used to find any discounts available for the cart at the time of checkout. Suppose that the DiscountService is a microservice running on Kubernetes, and the CheckoutService Lambda function invokes the DiscountService. Also, for some analytics, the Checkout Lambda publishes messages to a few SQS Queues
Important Metrics
Request, Error, and Duration (RED)
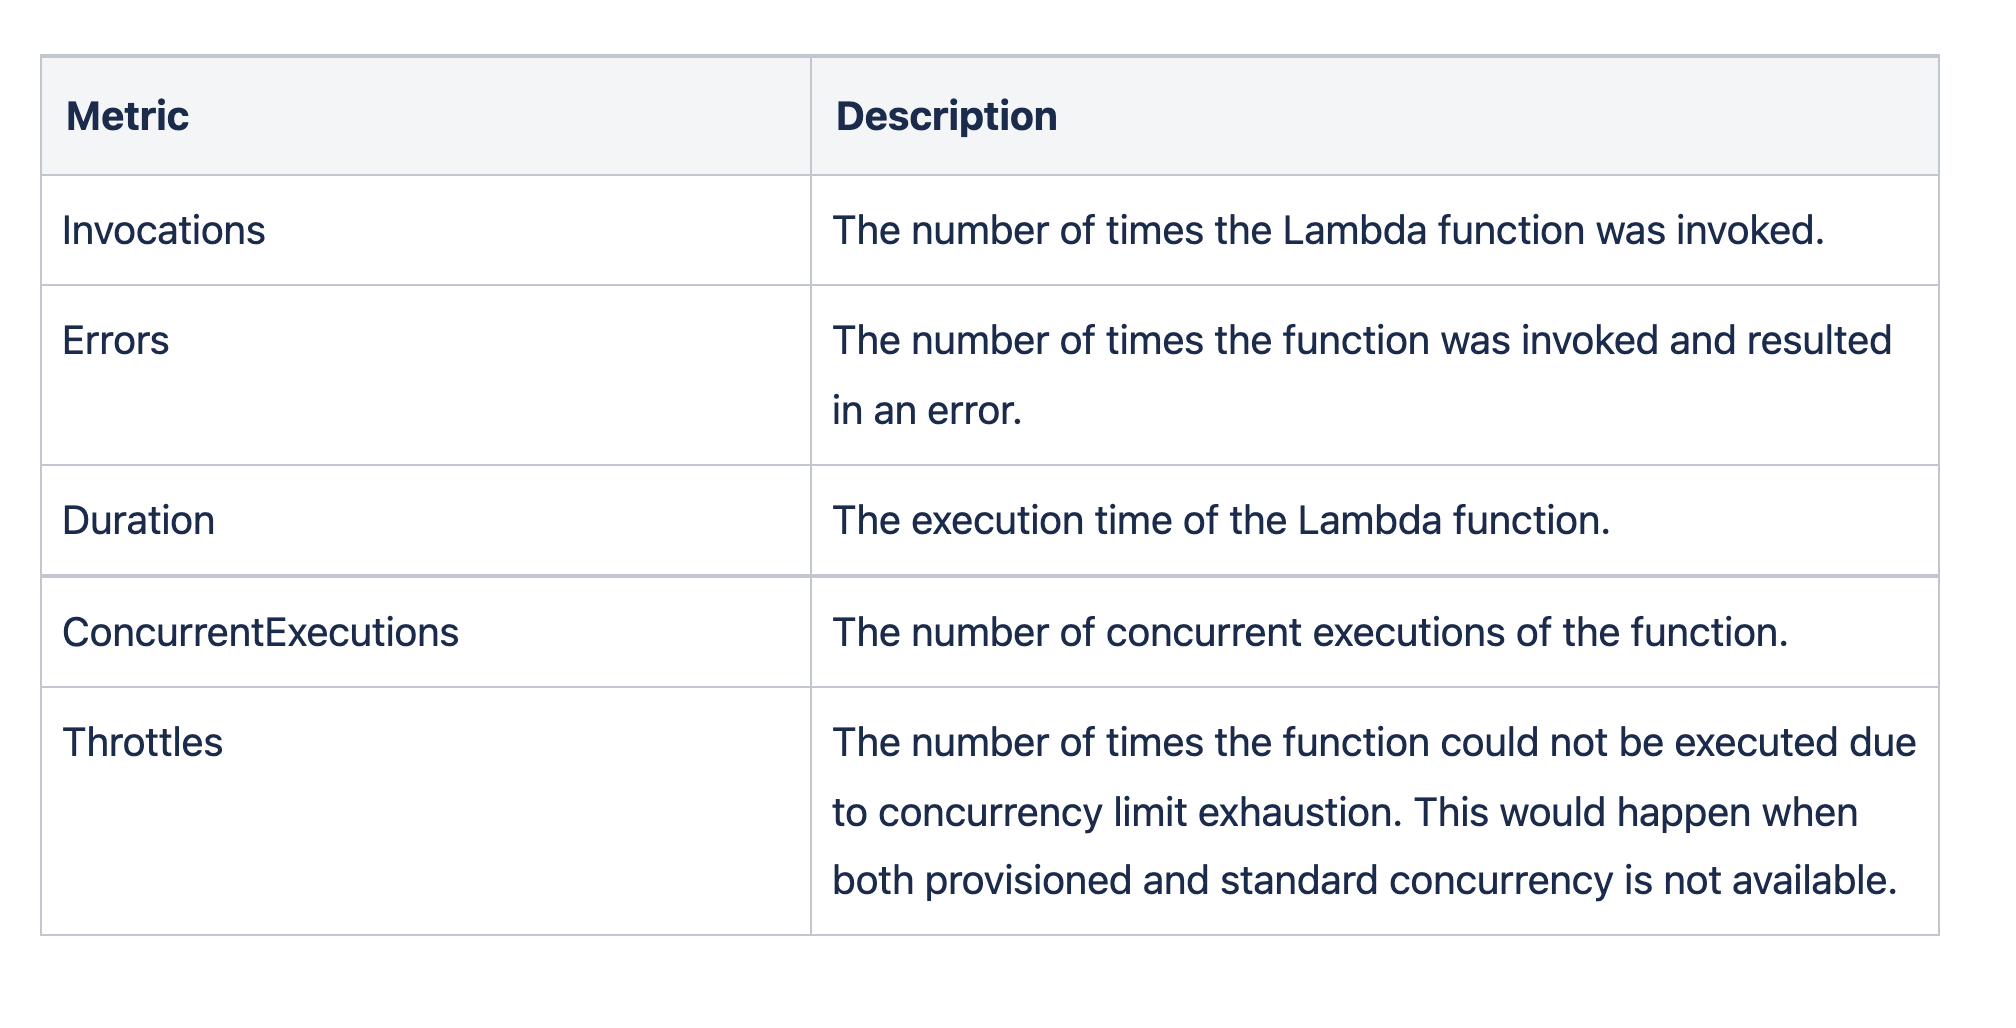
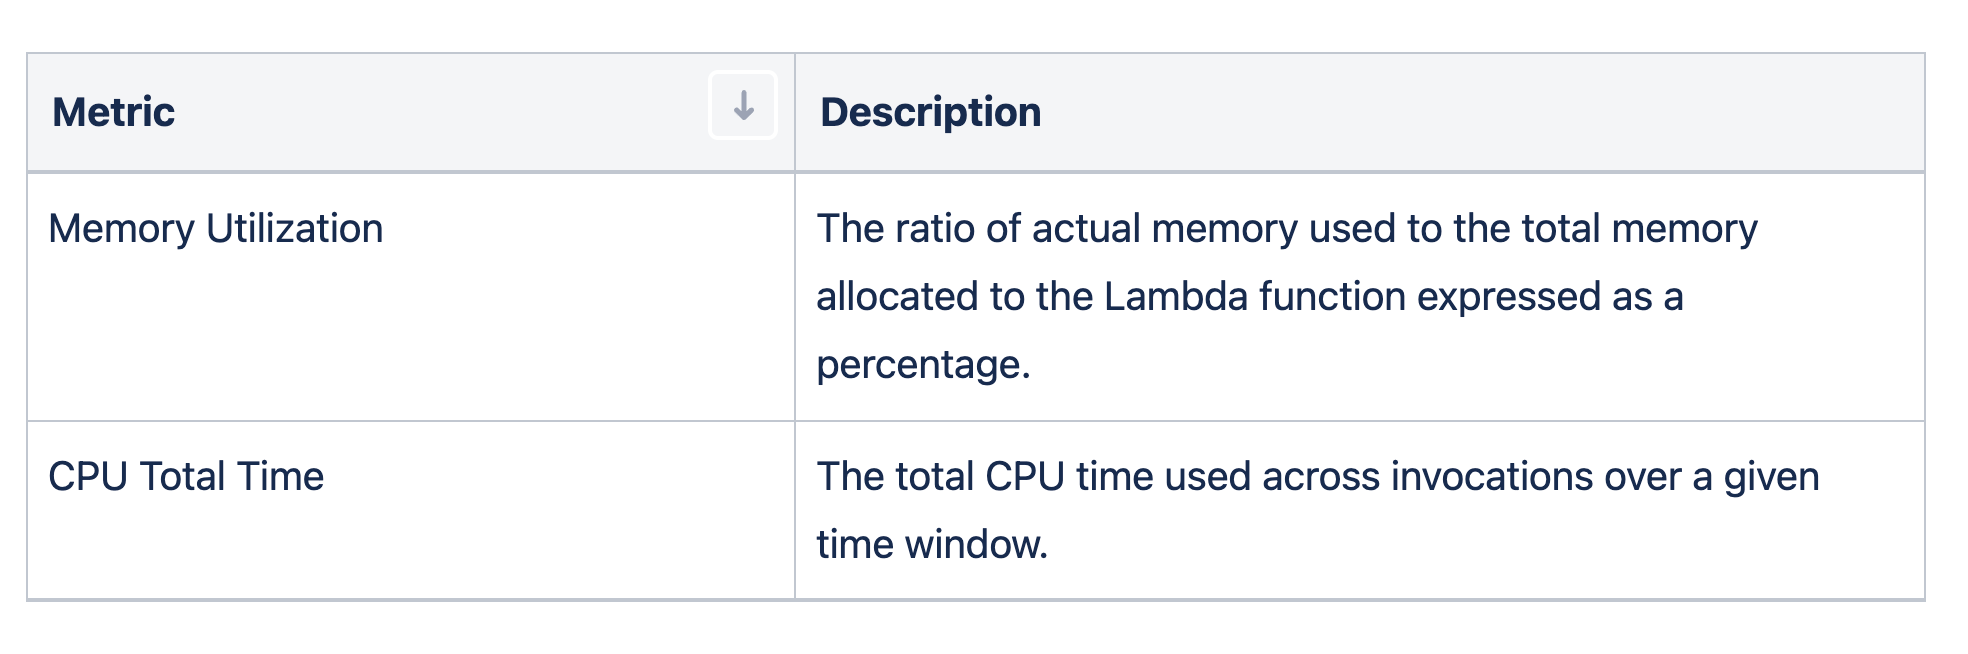
Resource Metrics
What to monitor?
Like any other application, the service owner of a Lambda function will care about availability and responsiveness.
In our example, we know the Lambda function and services that need monitoring. We also know what metrics are available. So it would seem that we should define thresholds for the metrics like latency and error rate and be notified when there are deviations. But it's not as straightforward as it might seem. Systems operating at scale have errors in some parts all the time. As an SRE, you would like to be alerted only when there is an impact on business. If you set up alerts based on errors or latency degradations, it could lead to alert fatigue. This is where SLOs fit in. SLOs help align monitoring with business objectives and prevent alert fatigue. So let’s identify the business requirements and define the SLOs based on them.
The business requirement is to track the availability and responsiveness of the CheckoutService Lambda every week.
- Checkout needs to be available
99.9%time, and - Response time should be within
3s99.9%of the time
Monitoring with Prometheus and Grafana
Now that the metrics and the requirements have been identified, monitoring the metrics can be achieved in CloudWatch itself. Alternatively we could use the widely used combination of Prometheus and Grafana. This makes it possible to manage Monitoring as Code The CloudWatch metrics can be exported to Prometheus using exporters like AWS CloudWatch Exporter, YACE or using AWS Kinesis Data Firehose and Grafana can be used to create Dashboards.
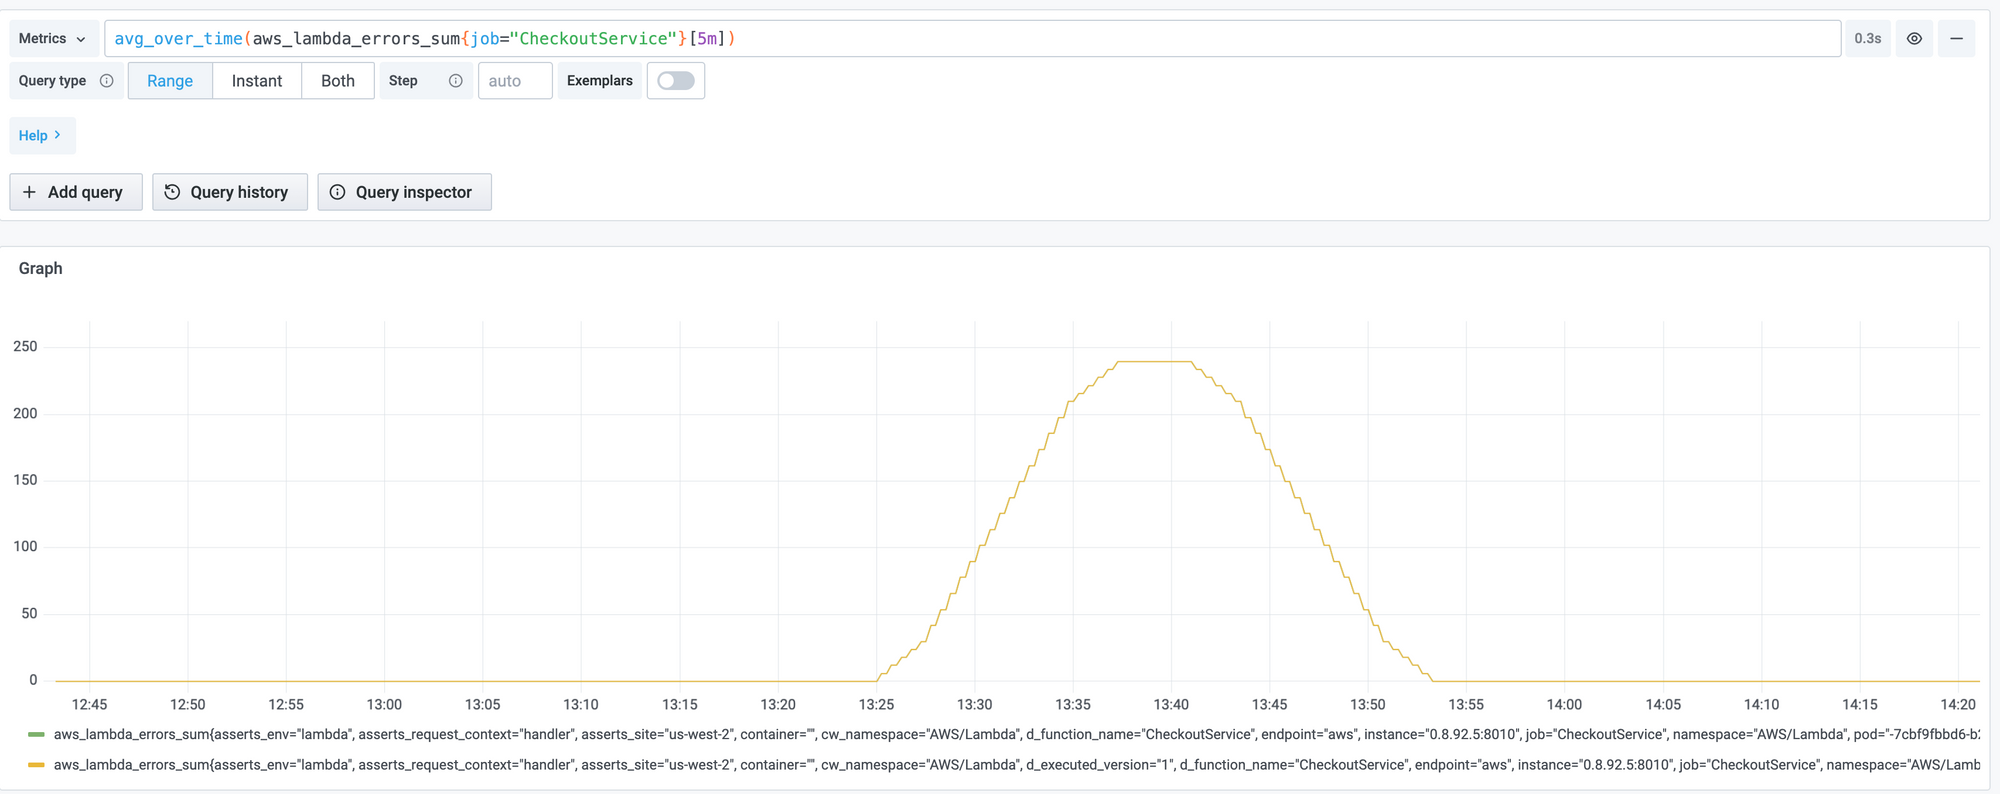
However, this is just a start. You will need to learn PromQL, setup the AlertManager, create alert rules with possibly different thresholds for different functions. Defining the SLOs and tracking their compliance is another bunch of work that is not straightforward.
In the next section of this blog post, we will see how Asserts makes it extremely easy to monitor the CheckoutService Lambda function, automatically identifies the Key Performance Indicators (KPIs), surfaces assertions based on SAAFE model, and makes it very easy to define and track the SLOs driven by business requirements.
Monitoring with Asserts
To monitor your AWS Lambda applications with Asserts, you must install the Asserts Exporter which will export the metrics to Asserts Cloud. Once you have installed the exporter, Asserts will automatically discover the Lambda functions and start surfacing the Assertions.
Discovery and Search
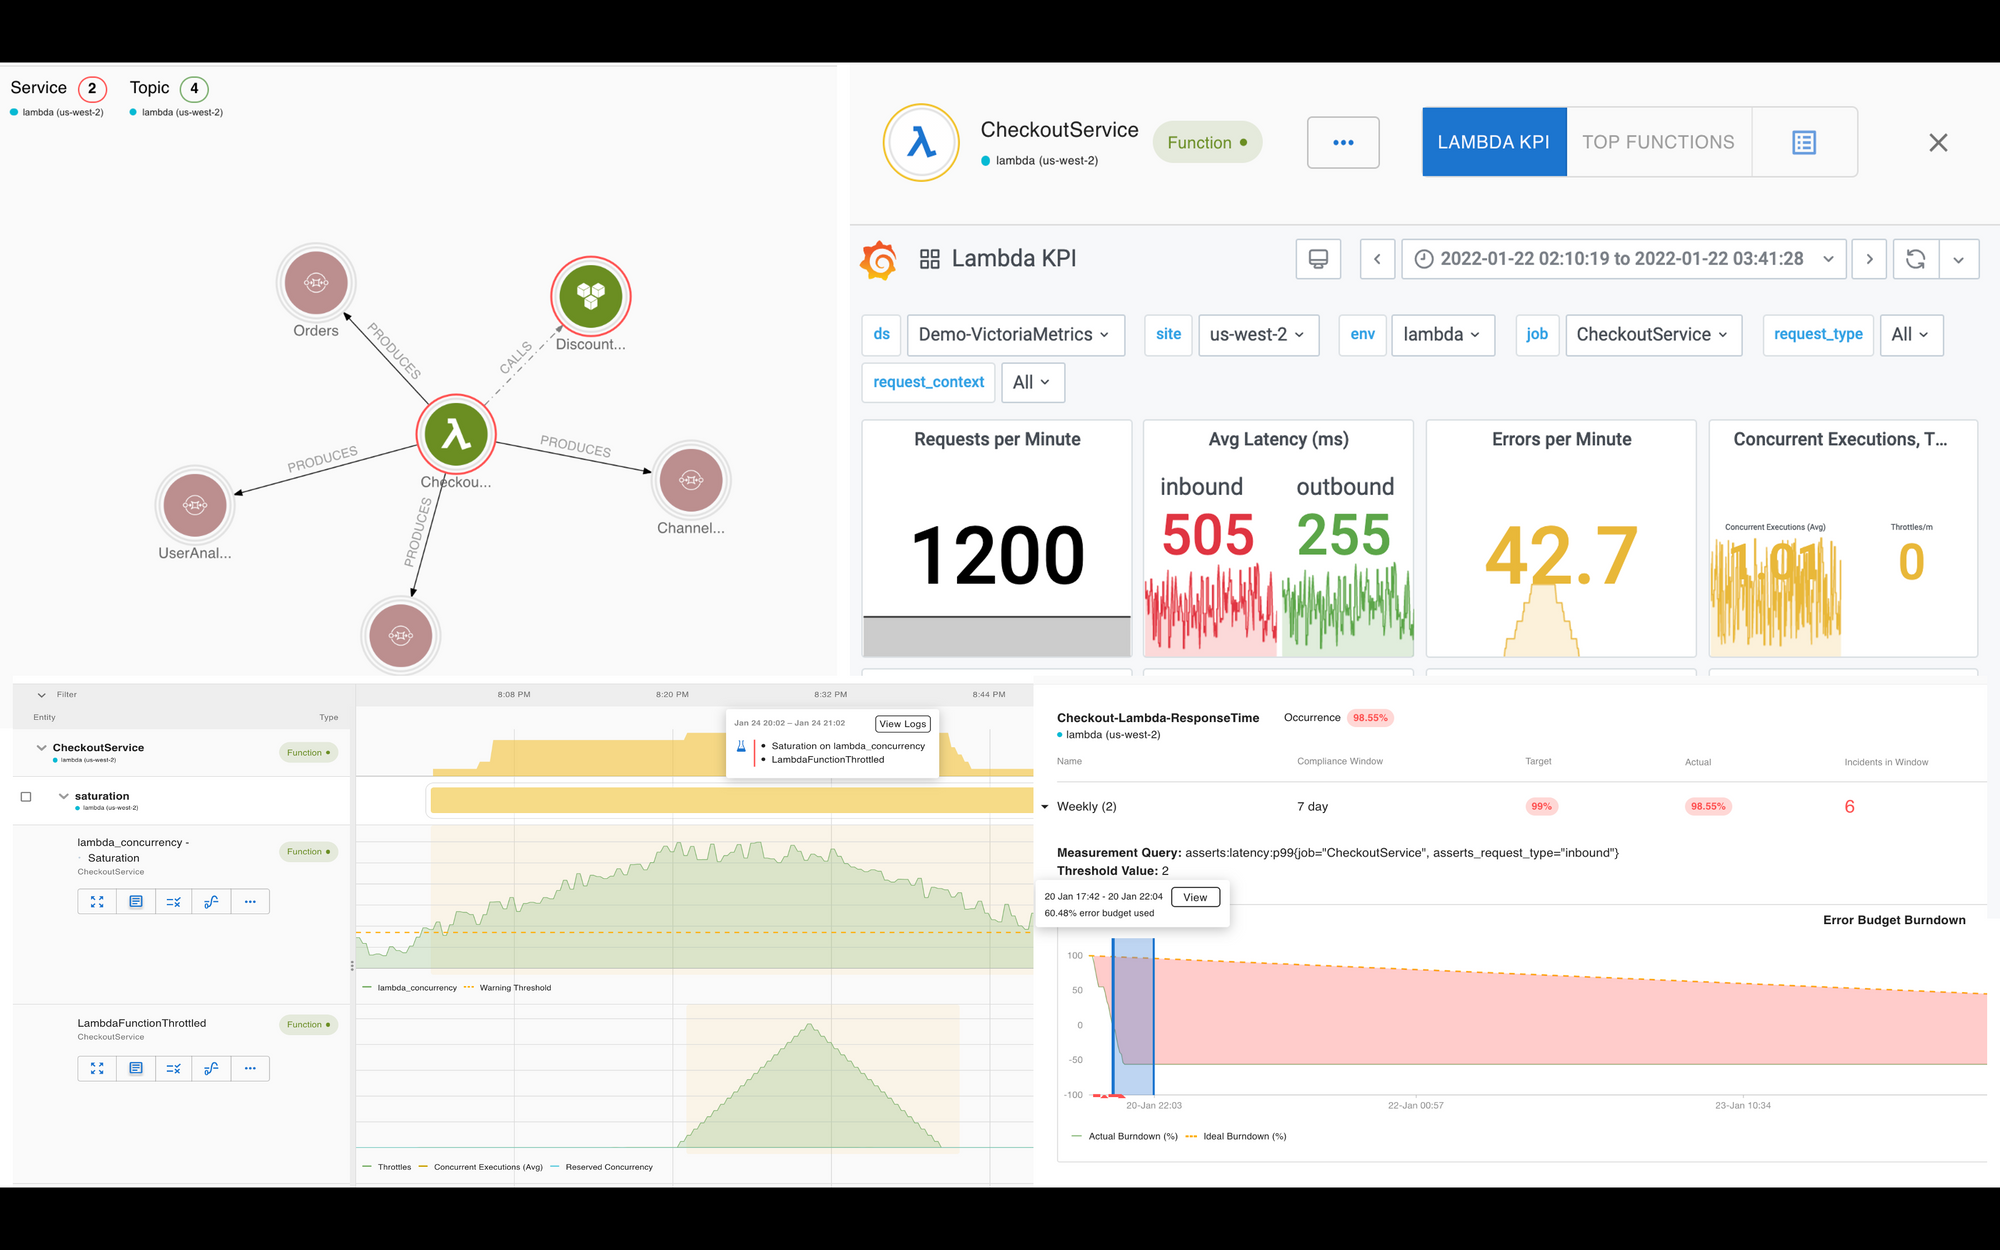
Once the Asserts exporter is set up, all the Lambda functions and other services they interact with will be discovered automatically. These can be seen on the Entities Page. For convenience, two search expressions are available out-of-the-box. Show All Lambda functions and Show Lambda <Function-Name>. In addition, you can also create custom search expressions. Here is one such saved search created for the example in this blog
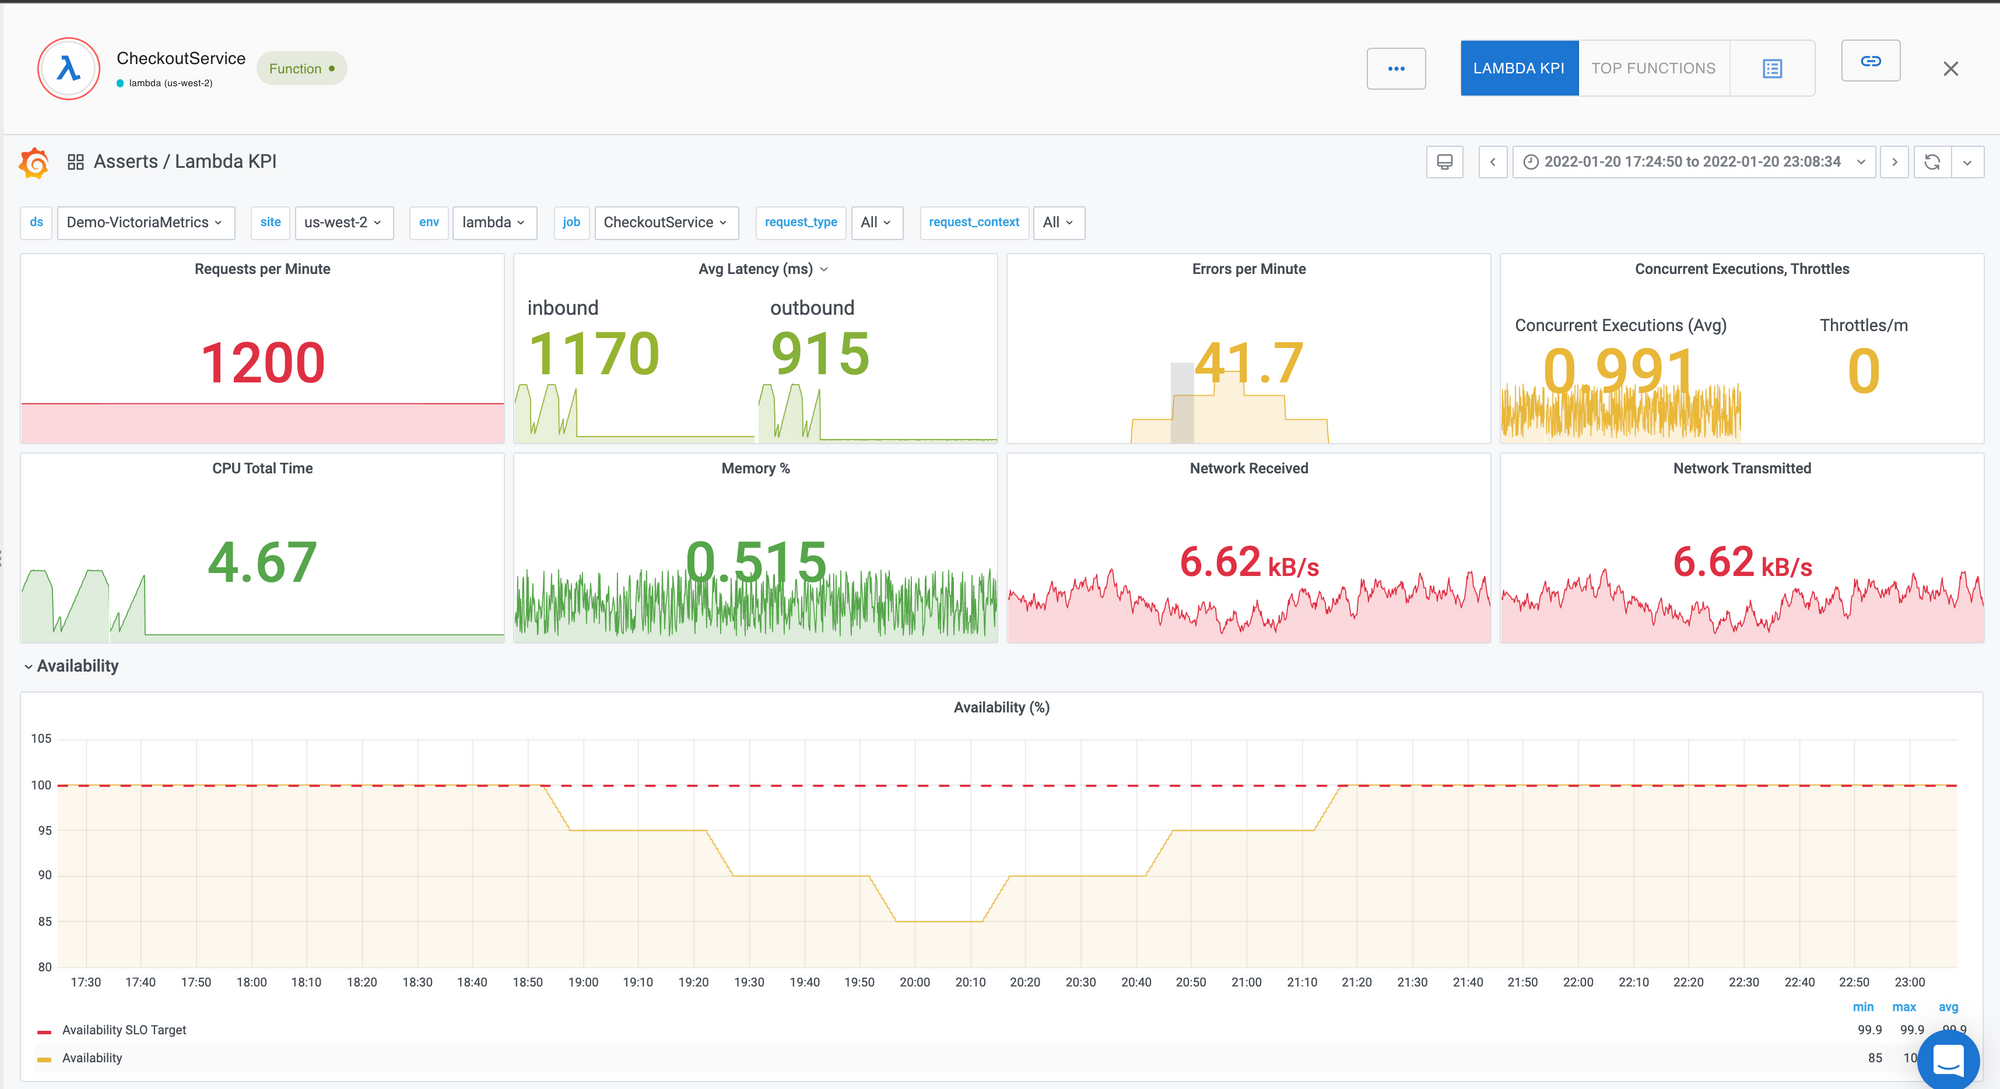
Key Performance Indicators
Asserts automatically identities the Key Performance Indicators(KPIs) for the Lambda function and builds a curated dashboard where these KPIs can be viewed.
Assertions
Once a Lambda function is discovered, Asserts will automatically start monitoring the KPIs, trigger Assertions based on the SAAFE model and Incidents based on Assertion Configuration.
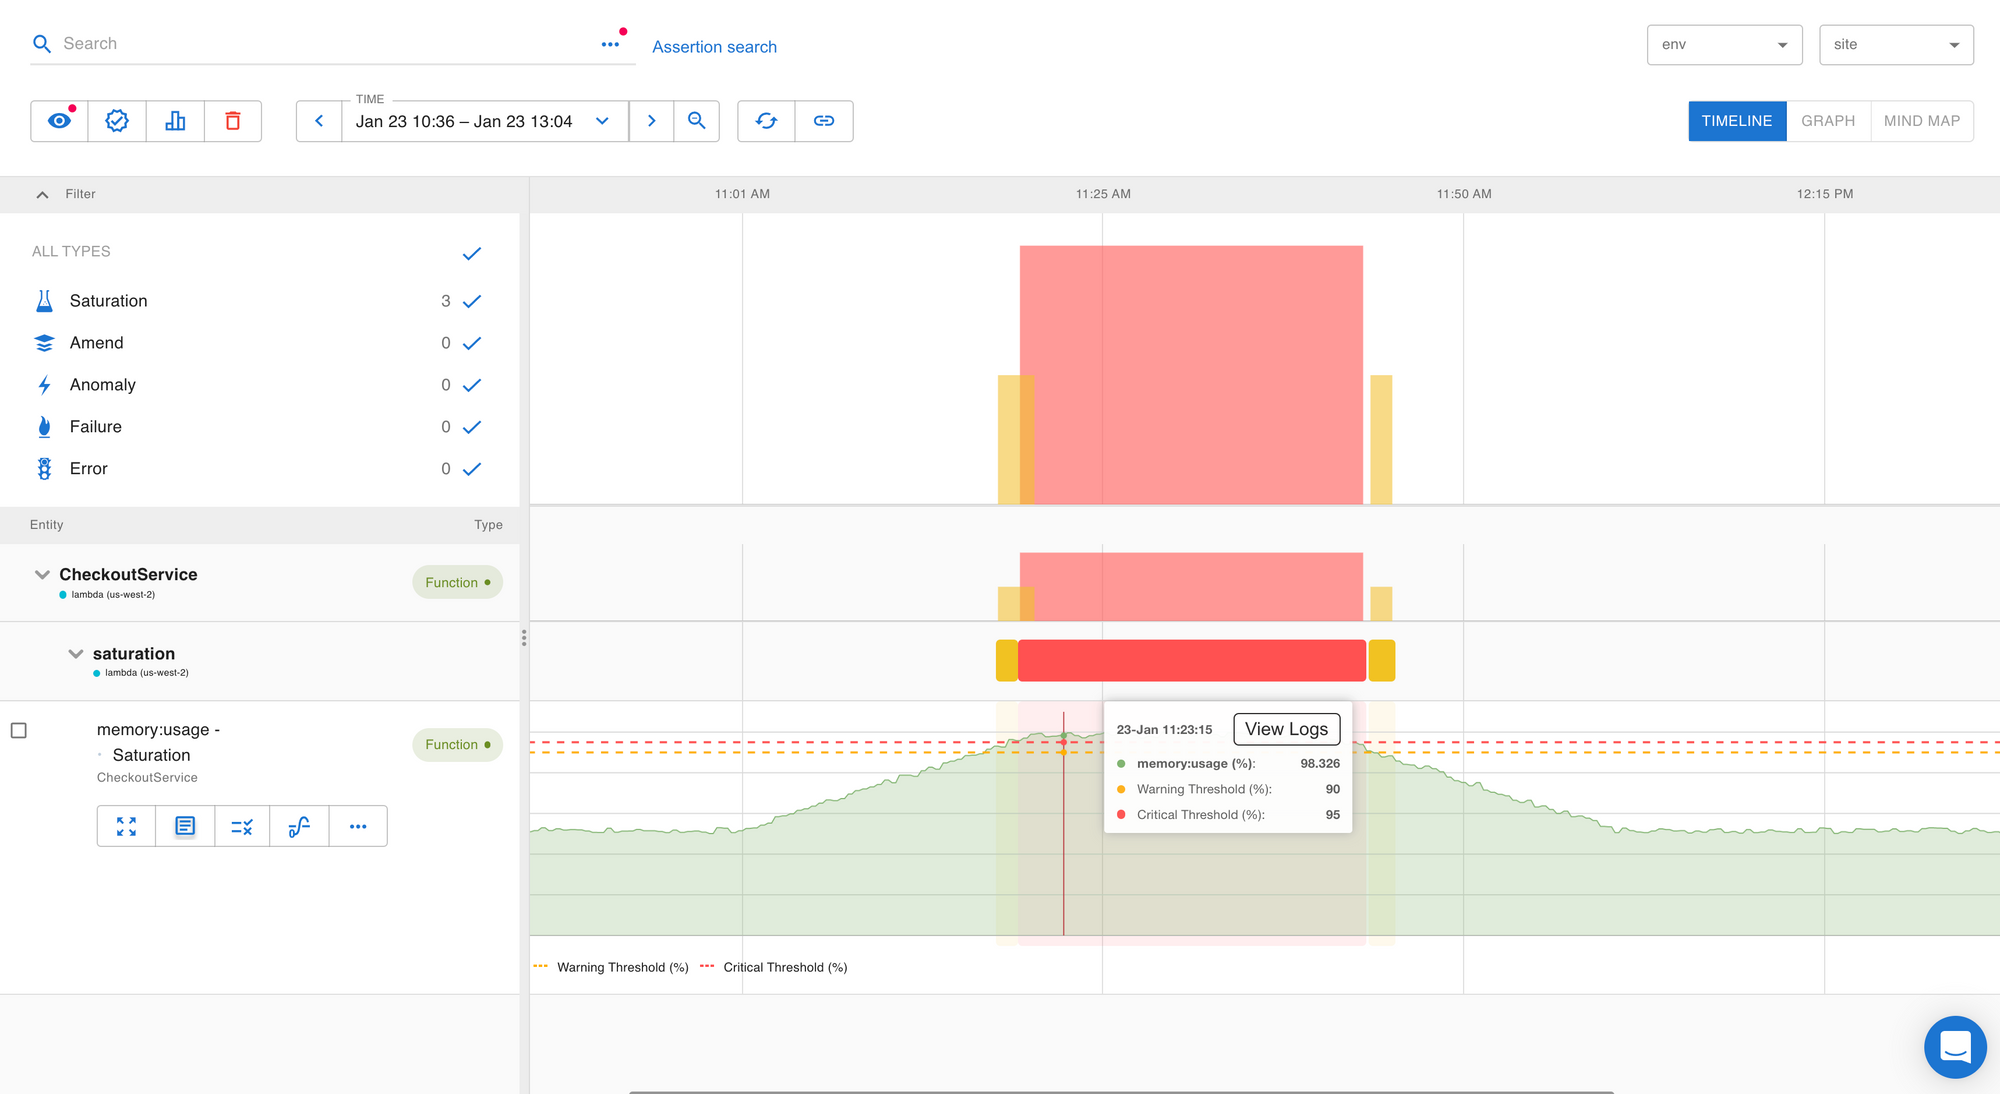
Saturation
Memory Saturation
Based on the Lambda function’s configured memory limit, Saturation alerts are triggered when the memory utilization exceeds the threshold.
Provisioned Capacity Saturation and Throttle Assertion
If your standard concurrency for the region or provisioned concurrency for your function is close to exhaustion, a Saturation assertion is generated with resource type set to lambda_concurrency.
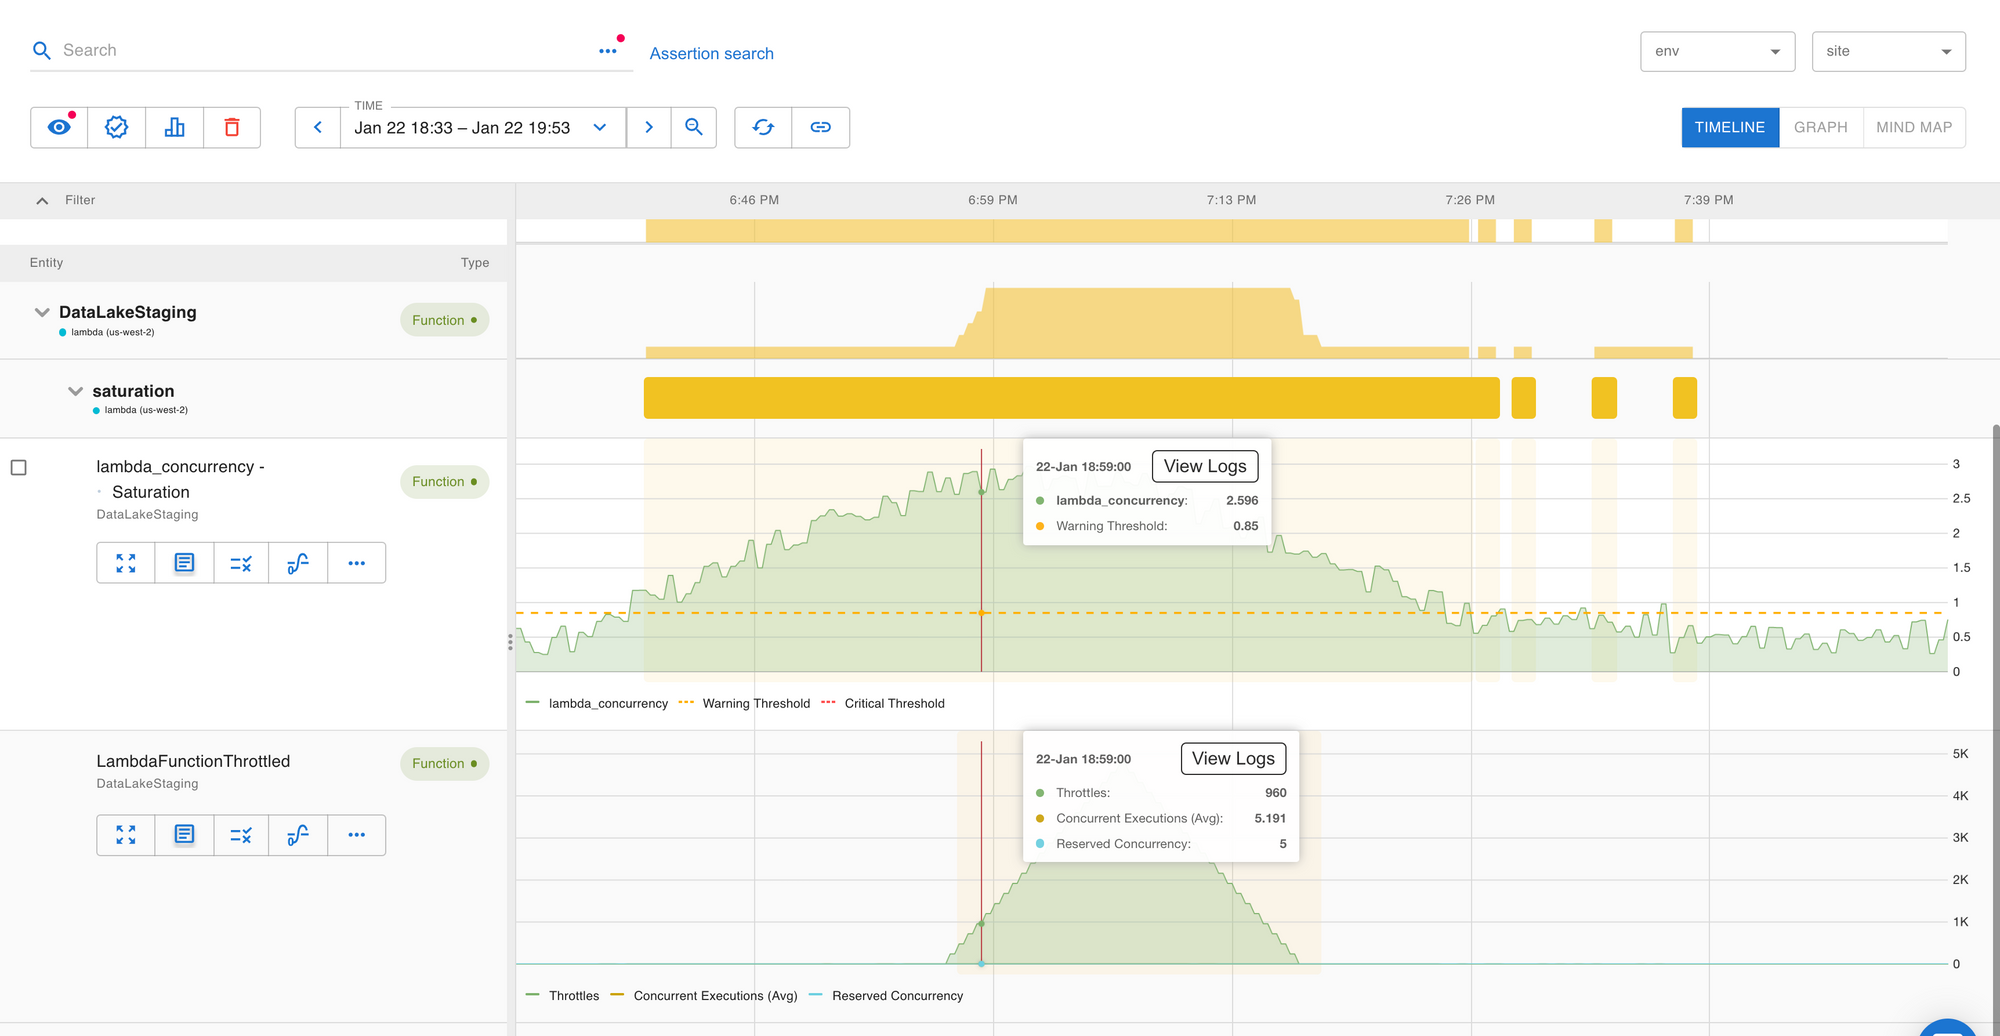
When throttling does occur, Asserts will generate a LambdaFunctionThrottled assertion. Although throttling is a trailing indicator, it may be a temporary problem and may not indicate any actual errors or lost processing, so it is treated as a warning.
Availability and Response Time monitoring through SLOs
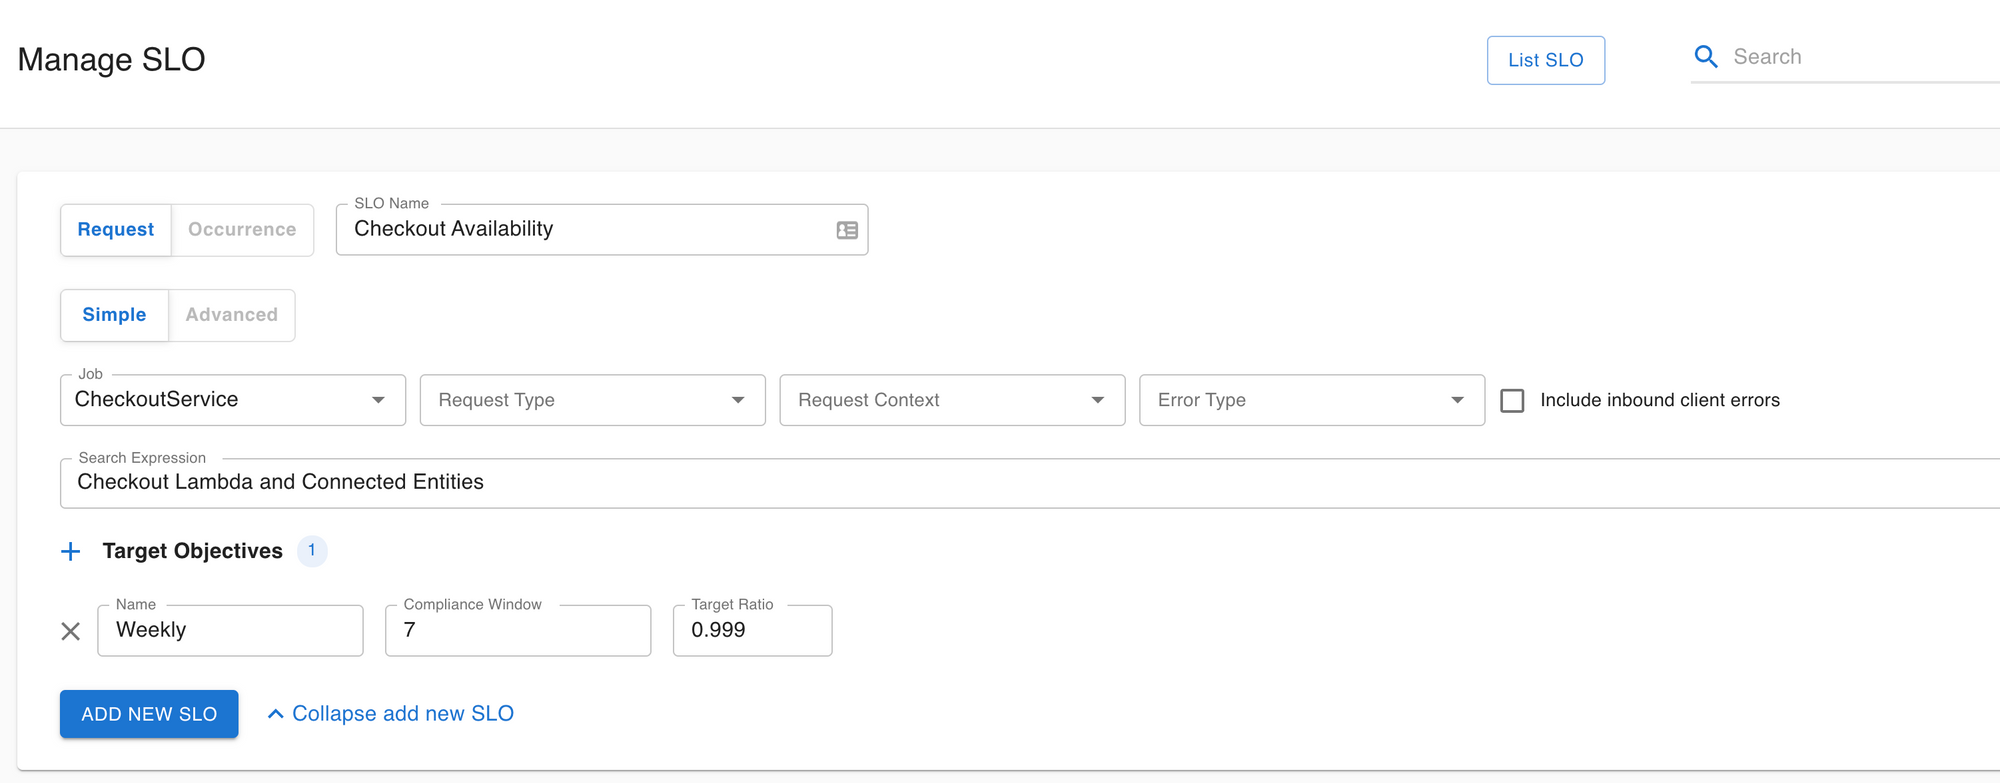
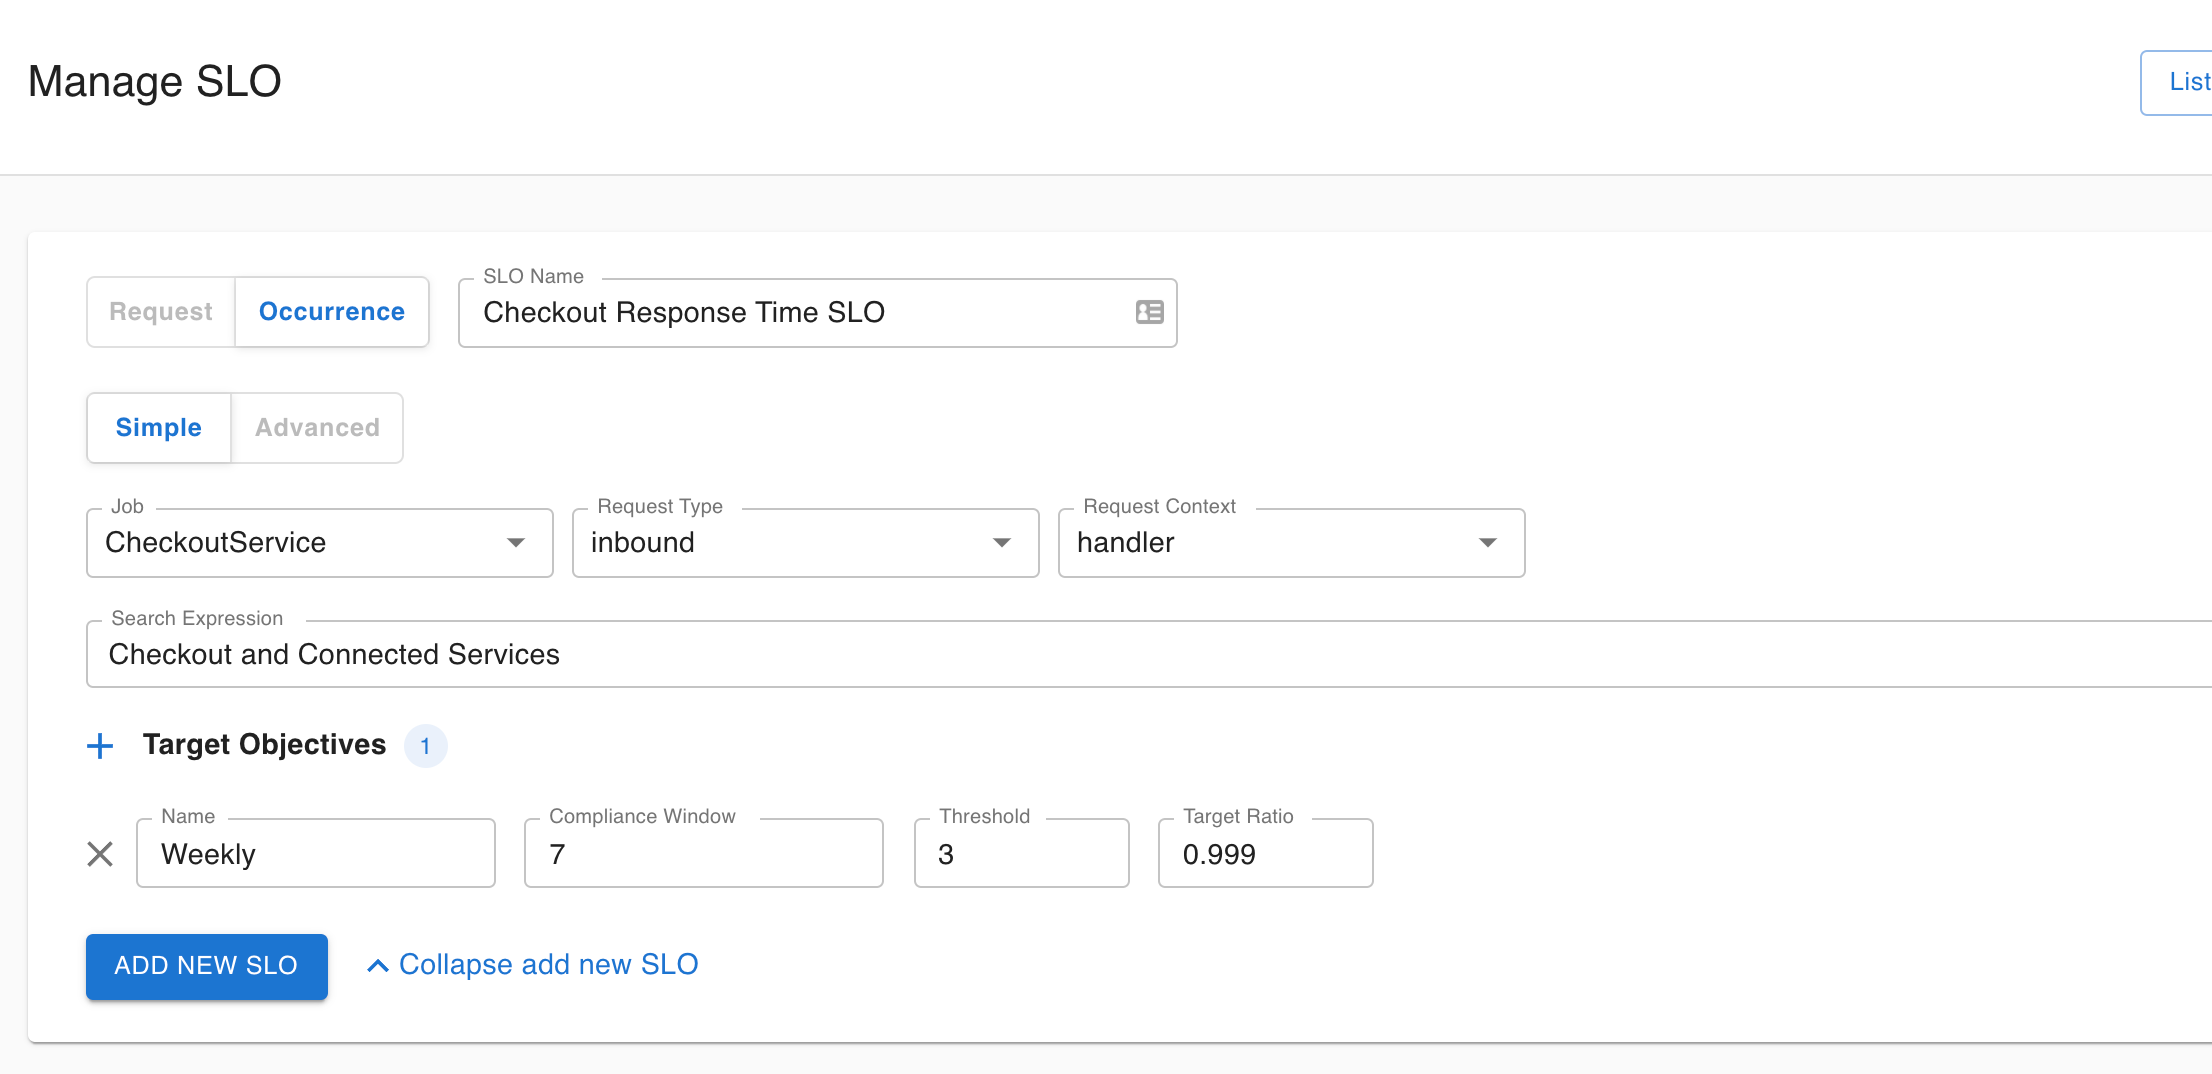
Since the Availability and Response Time business requirements are known, we can define the SLOs based on these. In Asserts, you can do this on the Manage SLOs page. It just takes a few clicks to define an SLO. Select the Lambda function, specify the SLO target objectives and save. You can also associate a search expression or saved search with the SLO for convenient navigation from the SLO view to the Workbench when doing RCA of incidents.
Incidents
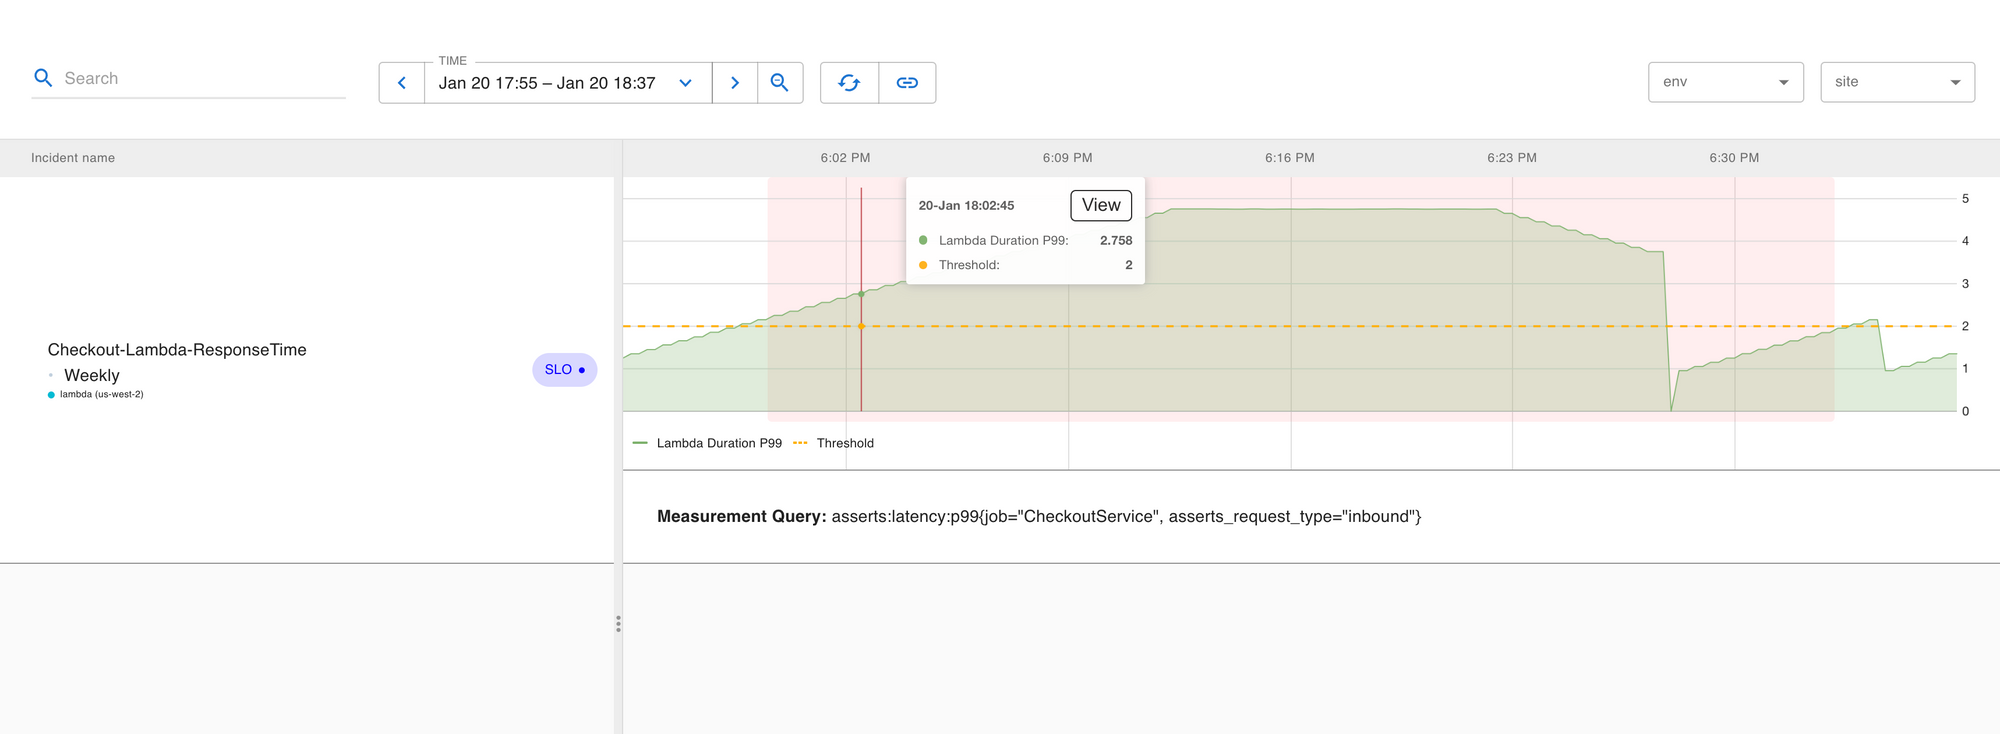
Here is an example of what the Incidents page looks like. Asserts makes it very easy to start troubleshooting incidents. The View link adds the Checkout Lambda to the Workbench with the time window aligned to the Incident
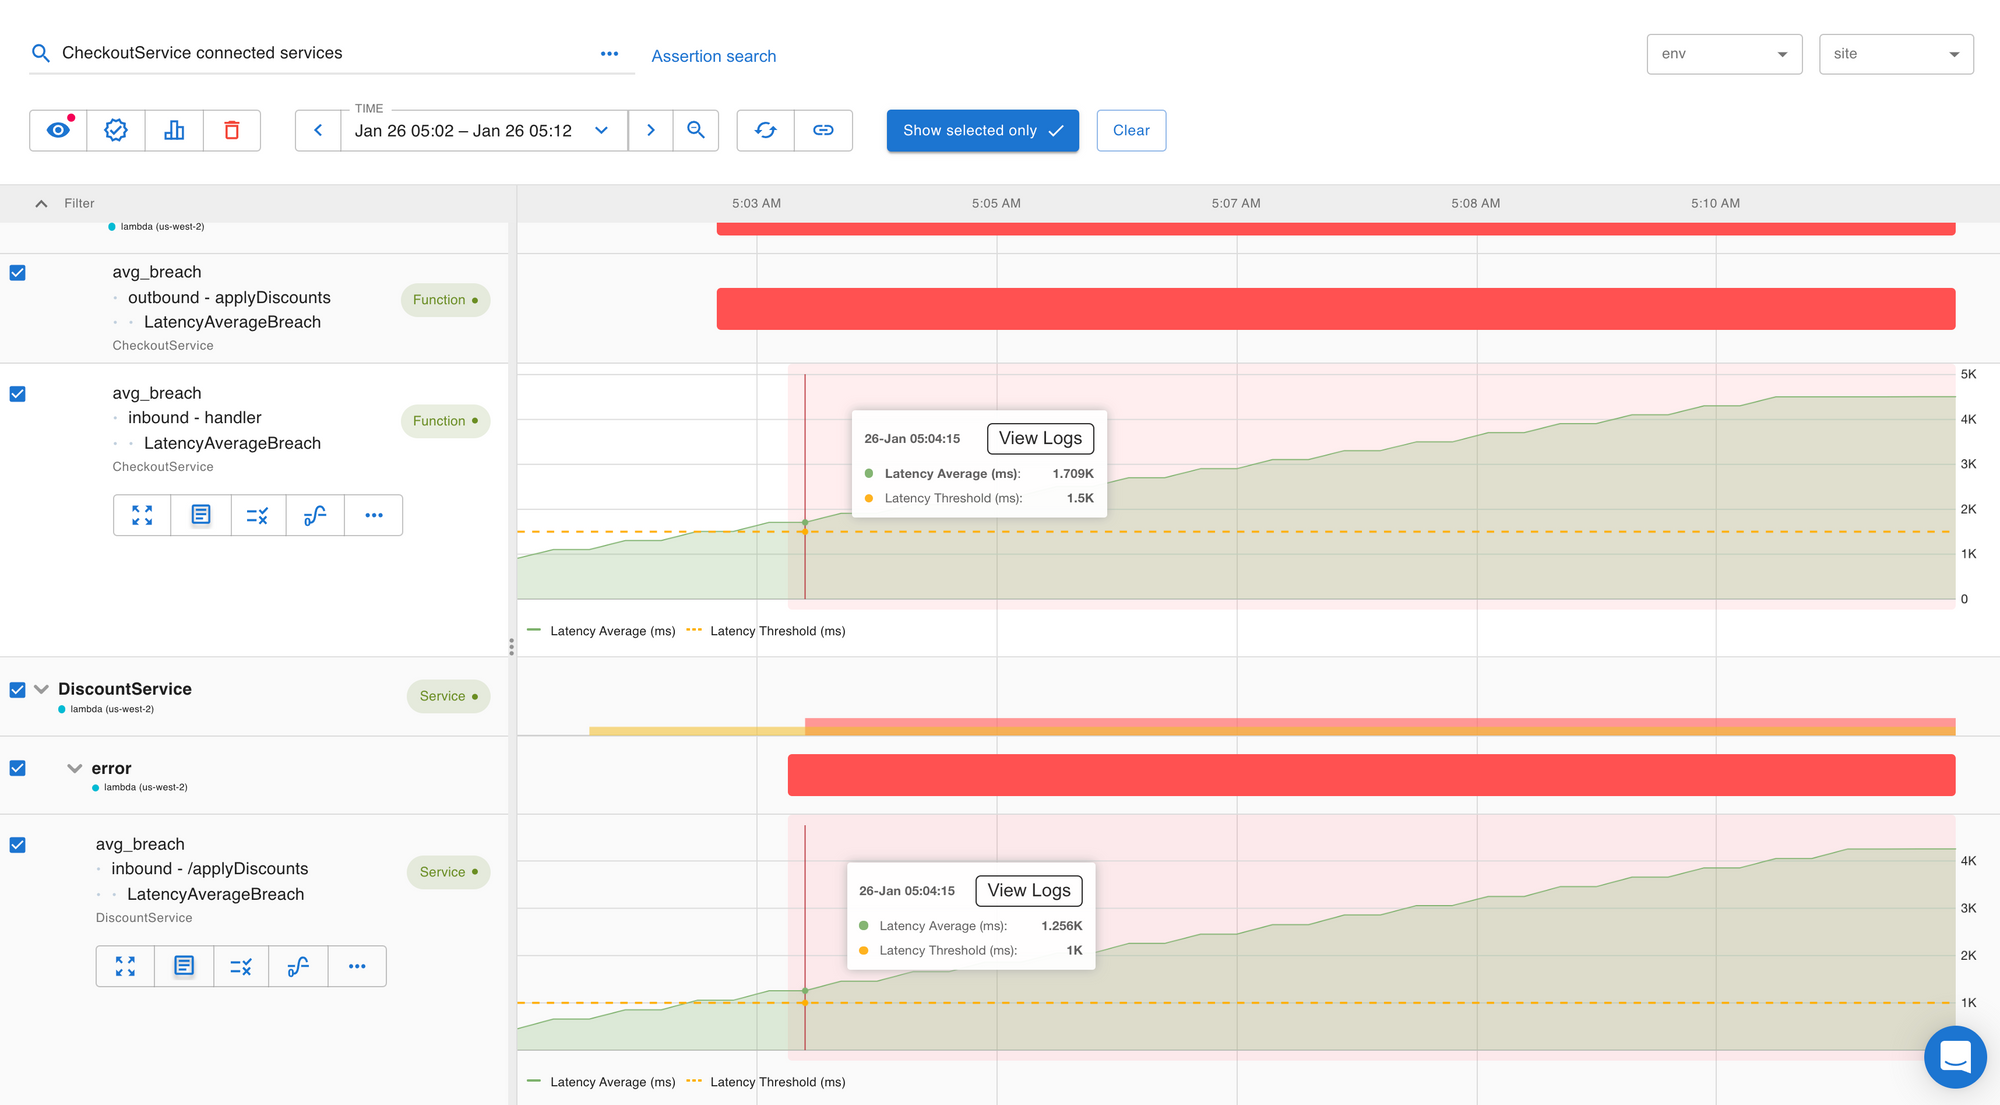
RCA in the Workbench
The workbench allows for the spatial and temporal correlation of problems between the Lambda and its connected entities. In just a few clicks, Asserts will visualize your root cause.
In this example, we can see that the errors in CheckoutService were caused by errors in the DiscountService. This is a simple example that illustrates this. This capability would be even more powerful when the interactions are complex.
Summary
As we have seen, Asserts helps meet all your AWS Lambda observability requirements and also enables powerful troubleshooting capabilities. To summarize,
- Asserts Lambda monitoring is effortless to use. You need to set up the Asserts AWS Exporter once.
- Asserts' assertions surface all the Golden Signals for your Lambda function out of the box without any additional configuration
- Asserts provides a simple interface to define, track and monitor SLOs and reduce alert fatigue
- Asserts makes it possible to do RCA of incidents in a few clicks.