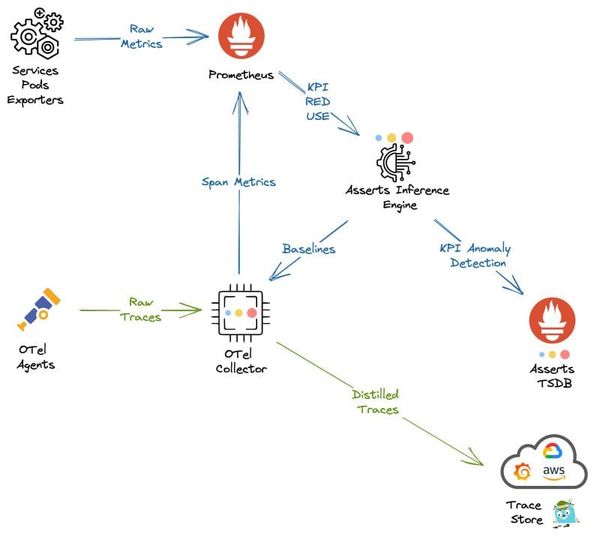
Tracing Substantially Reduce Observability Costs with Asserts Data Distiller Observability produces a lot of data which consumes compute and storage resources with their associated costs. Asserts Data Distiller observes everything only retaining what matters, significantly reducing costs.
Root Cause Analysis Finding And Fixing Common Kubernetes Problems Kubernetes does a fantastic job of running and scaling application workloads. However, it can be tricky to find the source of problems when things don't go as planned.
Monitoring RabbitMQ with Prometheus RabbitMQ is the messaging heart of many applications. Learn how to monitor its vital signs with Prometheus.
OpenTelemetry Avoiding The 20 Dashboard Tabs Problem "My mind is like my browser. It has too many tabs open, some of them are frozen and I don't know where the music is coming from" - Exhausted SRE trying to resolve an incident.
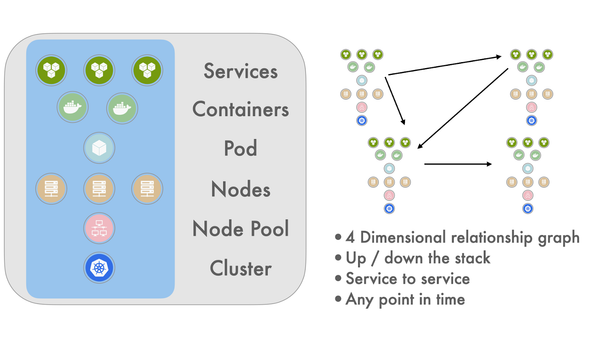
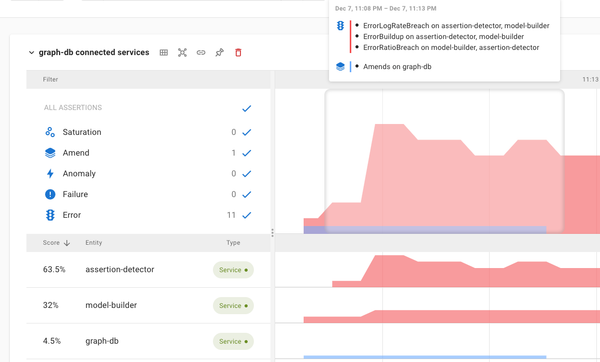
Getting Started Automatic Discovery of Application Topology Asserts automatically analyses metric and trace metadata to build a graph database of application component relationships over time. This information is used to collate all affected application components onto a single dynamic dashboard when an incident occurs.
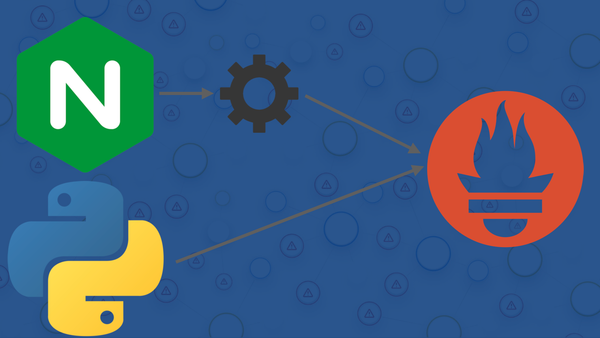
Monitoring Python Using Prometheus According to the Tiobe programming language popularity index, Python is number one and continuing to gain in popularity. For observability Prometheus has become the de facto standard for open source, with 1B+ pulls from Docker Hub and nearly 50k stars on GitHub. Many other open source projects include a Prometheus
Freemium Announcing Asserts Freemium Edition Asserts announces the free forever version. Yes that's right you can run Asserts on your own Kubernetes cluster for free, forever.
Prometheus Prometheus Exporters and Libraries Expanding Prometheus coverage of your applications is easy. Exporters can be added with just minor configuration changes. Adding client libraries for code coverage is just a few lines.
SLOs Keep Your Applications SAAFE with Asserts Asserts is built around the best practices laid out in the SRE Handbook and uses SAAFE for its assertion categories extending the Golden Signals described in the handbook. Traditionally Golden Signals have used the Rate, Errors and Duration (RED) or Utilisation, Saturation and Errors (USE) methodologies. The SAAFE methodology embraces
Tracing Tracing is on Trial Tracing is just structured logging at DEBUG level. Would you run logging at DEBUG in production? No!
Prometheus An Introduction to Prometheus Over the years it has become the de facto standard for time series metrics across the CNCF Landscape, with many projects providing a Prometheus metrics endpoint as standard.
Root Cause Analysis Speed up RCA by Going SLO Once you stop fretting over each individual service, you should change your monitoring strategy accordingly. Your primary consideration becomes making sure your application is processing requests in a prompt and error free manner.