Monitor React Applications with Prometheus


Prometheus was originally designed for monitoring backend services, so using it for observing React applications has not been a common practice. In this blog post, we will take a look at how we can use Prometheus to monitor React applications there by using a single monitoring tool across your application architecture.
Monitoring Asserts UI
At Asserts, we have been dogfooding our own product and using it to monitor our backend services; read more about it in our launch blog. We wanted to extend it to track the user experience of our customers, won't it be cool to use our UI to detect problems in our own UI :)
After some research, we found out that libraries that can help us publish Prometheus metrics for the front-end already exist. We were able to configure them and add them to our react application.
Instrumenting with prom-react and Publishing custom metrics
prom-react is built on top of promjs and react-performance libraries and adds the ability to wrap a React application in a MetricsProvider that supplies golden signals (Traffic & Latency metrics) by default like:
const goldenMetrics: MetricDefinition[] = [
  {
    type: 'counter',
    name: GoldenMetrics.AppLoaded,
    description: 'Application loaded counter',
  },
  {
    type: 'counter',
    name: GoldenMetrics.AppUnloaded,
    description: 'Application unloaded counter',
  },
  {
    type: 'histogram',
    name: GoldenMetrics.PageNavigation,
    description: 'Total navigation duration between pages in seconds',
  },
  {
    type: 'histogram',
    name: GoldenMetrics.PageTimeToComplete,
    description: 'Section time to interactive in seconds',
  },
  {
    type: 'histogram',
    name: GoldenMetrics.PageTimeToUsable,
    description: 'Section time to usable in seconds',
  },
  {
    type: 'histogram',
    name: GoldenMetrics.PerformanceTime,
    description: 'Application performance load time in seconds',
  },
];We were missing one more metric - measuring the duration of ajax requests, but prom-react allows us to add custom metrics.
We are now getting the following metrics:
- App load & unload
- Navigation time between pages (by each page URI)
- Application performance load time in seconds (Load, DomContentLoaded, TimeToFirstByte, TimeToFirstPaint, TimeToFirstContentfulPaint) across all pages
- Additionally, we measure backend AJAX response time
The docs for this use case are available here.
Now, let's take a look at what "react" problems we faced while integrating prom-react in our project.
Create-react-app, react-performance and .mjs files issue
After installing prom-react react app (that was created with a typescript template of CRA) crashed with the following error:
Failed to compile.

./node_modules/@shopify/react-performance/build/esm/performance-report.mjs
Can't import the named export 'Header' from non EcmaScript module (only default export is available)
It happened because prom-react re-exports react-performance and it contains .mjs files. It is a known issue that CRA crashes while using a package with a .mjs module export. The quick solution is react-app-rewired with the following config:
module.exports = function override(config) {
  config.module.rules.push({
    test: /\.mjs$/,
    include: /node_modules/,
    type: "javascript/auto"
  });

  return config;
}Also, changing scripts in package.json
from
  "scripts": {
    "start": "react-scripts start",
    "build": "react-scripts build",
    "test": "react-scripts test",
  },
to
  "scripts": {
    "start": "react-app-rewired start",
    "build": "react-app-rewired build",
    "test": "react-app-rewired test",
  },
That’s it! Now it compiles without any issues.
Monitor Ajax requests
The idea of prom-react is to have a single registry from promjs and provide it to all React components tree, so we can use usePerformanceMark hook to define Stages (Stage.Usable and Stage.Complete) more info on this can be found here. Our goal was to measure Latency of Ajax requests and in this case, we need to be able to use the same registry for calling .observe method from useMetrics hook. Of course, we can usePerformanceMark with stages that already include some information about Ajax request latency, but it is not precise, as it also contains rendering time. For purposes like this, and others (for example, exposing Snackbar to use notifier in Axios interceptors), we use npm library react-outside-call with this configuration of a custom metric.
import { MetricDefinition, useMetrics } from '@cabify/prom-react';
import { createCaller } from 'react-outside-call';

export const PROM_UI_REQUEST_SECONDS_COUNT: MetricDefinition = {
  type: 'histogram',
  name: 'prom_ui_request_seconds_count',
  description: 'A metric for UI request latency',
  buckets: [0.2, 0.5, 1, 2, 5, 10],
};

export const customPromMetrics: MetricDefinition[] = [
  PROM_UI_REQUEST_SECONDS_COUNT,
];

export const callConfig = createCaller({
  // eslint-disable-next-line react-hooks/rules-of-hooks
  metrics: () => useMetrics(),
});
Using Axios interceptors we measure request/response time and observe this metric via callConfig of react-outside-call. Start time is put into request headers.
import axios, { AxiosInstance } from 'axios';
import { callConfig, PROM_UI_REQUEST_SECONDS_COUNT } from './constants';

export const apiHttpService: AxiosInstance = axios.create({});

apiHttpService.interceptors.request.use((req) => {
  req.headers = {
    'request-startTime': performance.now().toString(),
  };
  return req;
});

apiHttpService.interceptors.response.use((res) => {
  const start = res.config.headers?.['request-startTime'];
  const end = performance.now();

  callConfig.call.metrics?.observe(
    PROM_UI_REQUEST_SECONDS_COUNT.name,
    {
      uri: res.config.url?.replace(/\?.*/, '') || 'unknown',
      method: res.config.method?.toUpperCase() || 'unknown',
      statusCode: res.status.toString(),
    },
    (end - start) / 1000,
  );

  return res;
});
Publishing metrics to Prometheus
Prometheus is designed to scrape targets. The library sends metrics to metricsAggregatorUrl configured for MetricsProvider. Prometheus aggregation gateway can be used to collect them. Now, if you access the /metrics endpoint of the aggregation gateway, you will see a list of metrics like this:
# HELP prom_react_app_loaded Application loaded counter
# TYPE prom_react_app_loaded counter
prom_react_app_loaded{app_name="jarvis",status="failure"} 18
prom_react_app_loaded{app_name="jarvis",owner="asserts",status="success"} 25826

# HELP prom_react_app_unloaded Application unloaded counter
# TYPE prom_react_app_unloaded counter
prom_react_app_unloaded{app_name="jarvis",owner="asserts"} 1877

# HELP prom_react_navigation_duration_seconds Total navigation duration between pages in seconds
# TYPE prom_react_navigation_duration_seconds histogram
prom_react_navigation_duration_seconds_bucket{app_name="jarvis",navigation_type="full_page",owner="asserts",path="/assertions",le="1"} 8876

# HELP prom_react_performance_seconds Application performance load time in seconds
# TYPE prom_react_performance_seconds histogram
prom_react_performance_seconds_bucket{app_name="jarvis",event_type="dcl",owner="asserts",le="1"} 7856
prom_react_performance_seconds_bucket{app_name="jarvis",event_type="load",owner="asserts",le="1"} 7771
prom_react_performance_seconds_bucket{app_name="jarvis",event_type="ttfb",owner="asserts",le="1"} 11321
prom_react_performance_seconds_bucket{app_name="jarvis",event_type="ttfcp",owner="asserts",le="1"} 6562
prom_react_performance_seconds_bucket{app_name="jarvis",event_type="ttfp",owner="asserts",le="1"} 8114

# HELP prom_react_ttc_seconds Section time to interactive in seconds
# TYPE prom_react_ttc_seconds histogram
prom_react_ttc_seconds_bucket{app_name="jarvis",navigation_type="full_page",owner="asserts",path="/",le="1"} 8876

# HELP prom_react_ttu_seconds Section time to usable in seconds
# TYPE prom_react_ttu_seconds histogram
prom_react_ttu_seconds_bucket{app_name="jarvis",navigation_type="full_page",owner="asserts",path="/",le="1"} 8876

# HELP prom_ui_request_seconds_count A metric for UI request latency
# TYPE prom_ui_request_seconds_count histogram
prom_ui_request_seconds_bucket{app_name="jarvis",method="POST",owner="asserts",statusCode="200",uri="/api-server/v1/search/assertions",le="1"} 759
After the metrics are in Prometheus, you can start running PromQL queries in the Prometheus UI or use Grafana Dashboards.
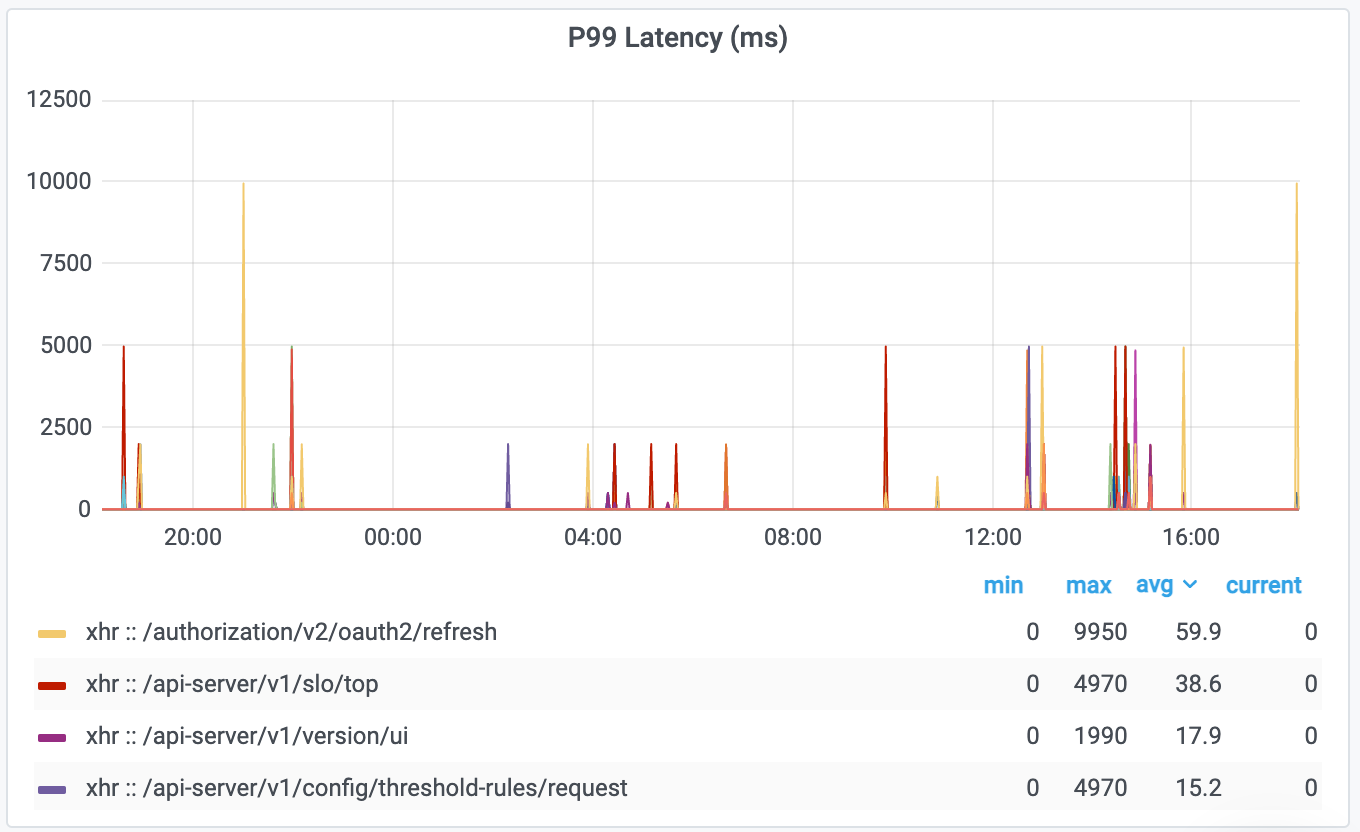
Getting insights and correlating with other backend metrics can be done with PromQL and Grafana dashboards. In a follow-up blog post, we will share how we used Asserts to automatically derive insights.
Conclusion
Single-page apps contain a lot of logic nowadays, so capturing metrics from the server as well as the client is important. By adding Prometheus instrumentation to the front-end, we can monitor latency experienced by the end users and root-cause FE load issues, etc.
A small example of prom-react with CRA can be found here:
 kozhuhds