Observe everything,
retain only what matters
Asserts contextualizes YOUR observability data into actionable root cause insights aligned to your SLOs.

Find out how Asserts helps to identify the root cause using your contextualized observability data in Kubernetes.
Asserts Intelligence Platform
Spot issues 10x faster. Cut data costs by 90%
Adopt Open source Observability with ease.

Discover
Asserts Correlation Intelligence™ - Living Entity Graph
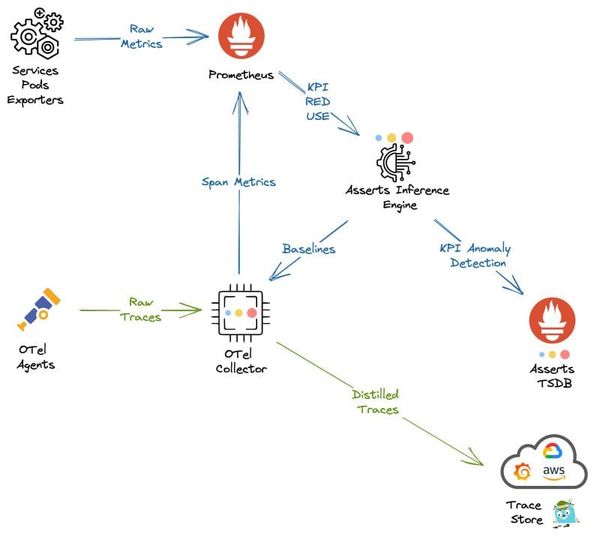
- Asserts analyzes metric labels from Prometheus exporters, service meshes (Istio, Linkerd, etc.), eBPF probe (Asserts) or OpenTelemetry traces to build the Living Entity Graph.
- When an incident is triggered, Entity Graph is used to collate all relevant components across app and infrastructure ensuring all troubleshooting data is just a click away.


Identify
Asserts Knowledge Base™ - Curated Library of Rules for your TimeSeries Data
- Asserts continuously scans your metric stream in order to gauge your infrastructure and application’s health.
- Asserts curates knowledge of common runtime failure patterns and potential causes so your team doesn’t have to maintain these complex PromQL recording and alerting rules.
- Asserts presents these findings in an easy to consume SAAFE™ Assertion model.
Record
Asserts Data Distiller™ - Reduce Your Data Footprint by 90%
- Metadata is compressed into a searchable graph and baselines are automatically generated for RED and USE metrics.
- Asserts aggregates and retains only the data you need for long term reporting and analysis - RED, USE, Assertions, SLIs, SLOs.
- Filtered traces - uses metric baselines to smartly sample slow and erroneous calls, significantly reducing processing and storage costs.


Alert
Actionable SLOs - Cut through alert noise and operationalize service quality
- Immediately see which SLOs are in danger of breaching and find out why your error budget is depleting.
- SLOs are not just for reporting, with Asserts, they are automatically integrated into the Assertion and Alerting framework so you are only woken up when it really matters.
Detect
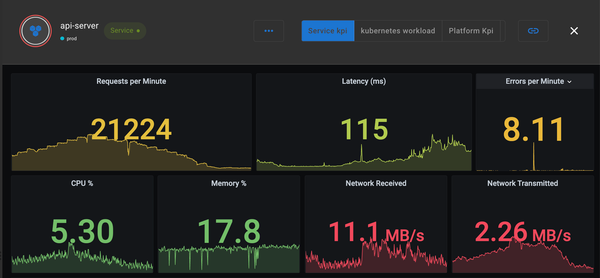
Asserts Intelligent Workbench™ - Spot Issues 10x Faster
- All components affected by an incident are automatically correlated in a single view.
- Just the right metrics (with baselines) and assertions right at your fingertips - resource Saturations, code & config Amends, request & latency Anomalies, Failures, and Errors.
- Quickly jump into logs and traces scoped to the component and time window of the incident in storage of your choice.


Asserts Knowledge Base™ - Curated contextual Dashboards
- Asserts automatically and dynamically links to technology specific Grafana dashboards with context.
- Eliminates toil from creating, maintaining and organizing dashboards - no more searching endlessly across multiple dashboards to find what you need.
Operationalize Open source monitoring with ease
Asserts is built on Open Prometheus & OpenTelemetry stack, adding intelligence to the metrics and traces you’re already capturing.
Sign up for private preview
Recent blog posts