Monitoring Python Using Prometheus

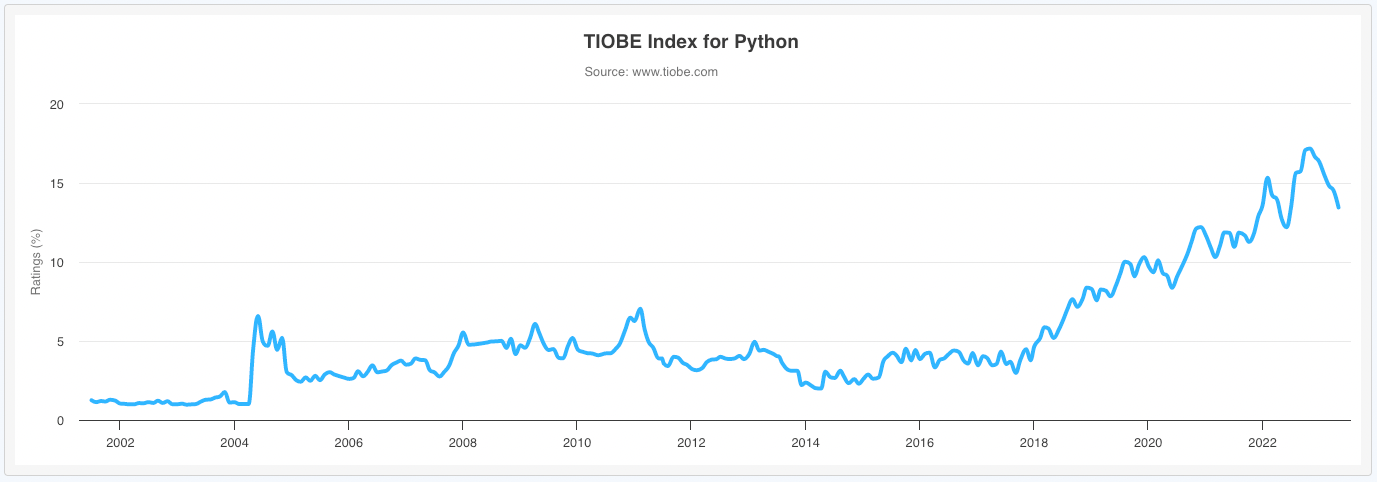
According to the Tiobe programming language popularity index, Python is number one and continuing to gain in popularity.
For observability Prometheus has become the de facto standard for open source, with 1B+ pulls from Docker Hub and nearly 50k stars on GitHub. Many other open source projects include a Prometheus metrics endpoint and for those that do not, there’s a comprehensive collection of exporters and a rich set of client libraries for most languages.
Taking a simple Python Flask application, this article will look at what’s required to monitor Python applications using Prometheus.
Python Flask
Flask is a popular, 63k GitHub stars, application framework for Python. It’s built on WSGI which provides the HTTP server and is an ideal approach for micro services applications. Flask handles the routing of HTTP requests to the matching Python function.
app = Flask('my-app')

@app.route('/health', methods=['GET'])
def health():
	return 'OK\n'
The snippet above shows the Flask application being initialised with the name "my-app" then a health check endpoint being added. Flask will call the health function for any HTTP GET request to the /health endpoint. The text "OK" along with a default HTTP Status Code of 200 will be the response returned to the client.
Request parameters can be handled in the URI path for REST services.
@app.route('/delete/<id>', methods=['DEL'])
def delete(id):
    error = None
    try:
    	delete(id)
    except Exception as err:
    	error = err

    if error:
        return str(err), 500
    else:
        return 'OK\n'
In this snippet the placeholder for the id parameter is declared in the path of the route. Flask will pass it in as the matching argument to the function. If an error occurs during the function call, the error message string and a status code of 500 is returned.
Rate Errors and Duration
Having written and deployed a Python Flask application, it would be useful to know how well it's performing. Keeping an eye on the number of requests handled, the duration of those requests and a count of any errors.
Prometheus is the ideal way to capture and store these metrics along with additional Python runtime metrics. To collect metrics for each endpoint and the Python runtime requires just a few simple modifications.
from prometheus_flask_exporter import PrometheusMetrics

def path(req):
    return '/' + req.path[1:].split('/')[0]

app = Flask('my-app')
metrics = PrometheusMetrics(app, group_by=path)
Prometheus Flask Exporter is one of many community open source integrations and is easily installed with pip. The path function is used to prevent a cardinality explosion by returning just the first element of the request path for grouping. That's all there is to it, the standard Prometheus /metrics endpoint will be exposed along with any endpoints of the application. The following metrics for each endpoint will be available:
- Request duration seconds - histogram
- Request total - counter
- Request exceptions total - counter
Add Your Own
Unlike commercial products, there's no limit to the number of additional metrics you can add.
metrics.info('version_info', 'application version', version='1.0.1')Following on from the previous example the Prometheus Flask Exporter library provides a convenience call to create additional gauges to hold for example version or build information.
Because the exporter is built on top of the standard client library, the regular metrics types can be used.
from prometheus_client import Histogram

cart_value = Histogram('my_app_cart_value', 'value of cart at checkout', buckets=[5, 10, 20, 50, 80, 100, 150, 200])

cart_value.observe(24.99)
Any regular metrics created will automatically be added for collection to the /metrics endpoint.
Using Metrics
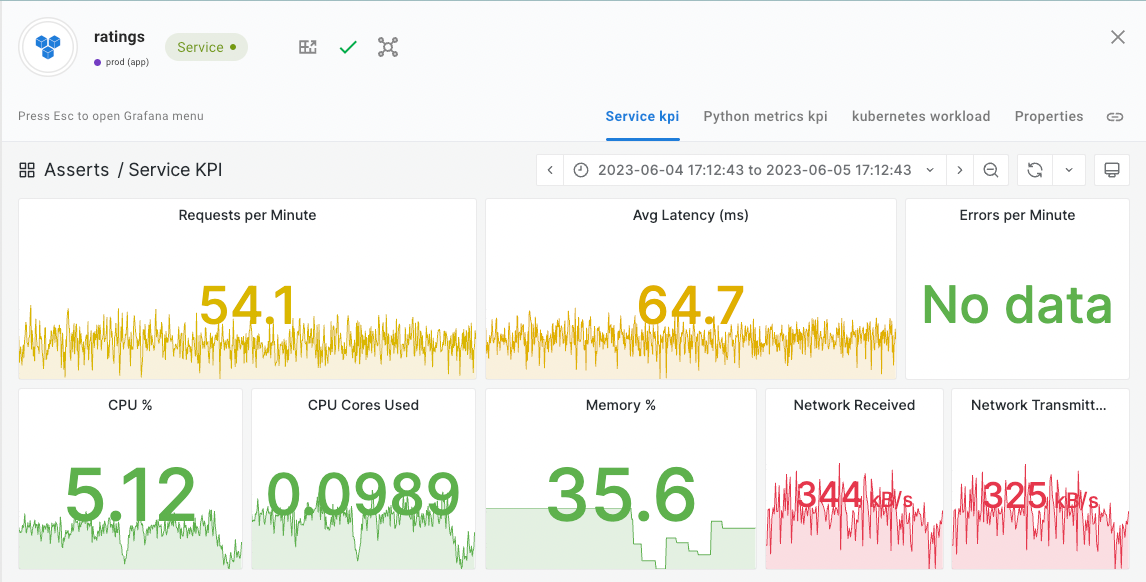
This article has shown just how easy it is to start collecting performance and business metrics from Python Flask applications. The next steps are to visualise the metric data on various dashboards and because nobody want to stare at dashboards all day, get alerted when things go wrong. At this point you could install Grafana to create a bunch of dashboards and configure Prometheus alerting rules. This is a lot of work and you're going to have to learn PromQL.
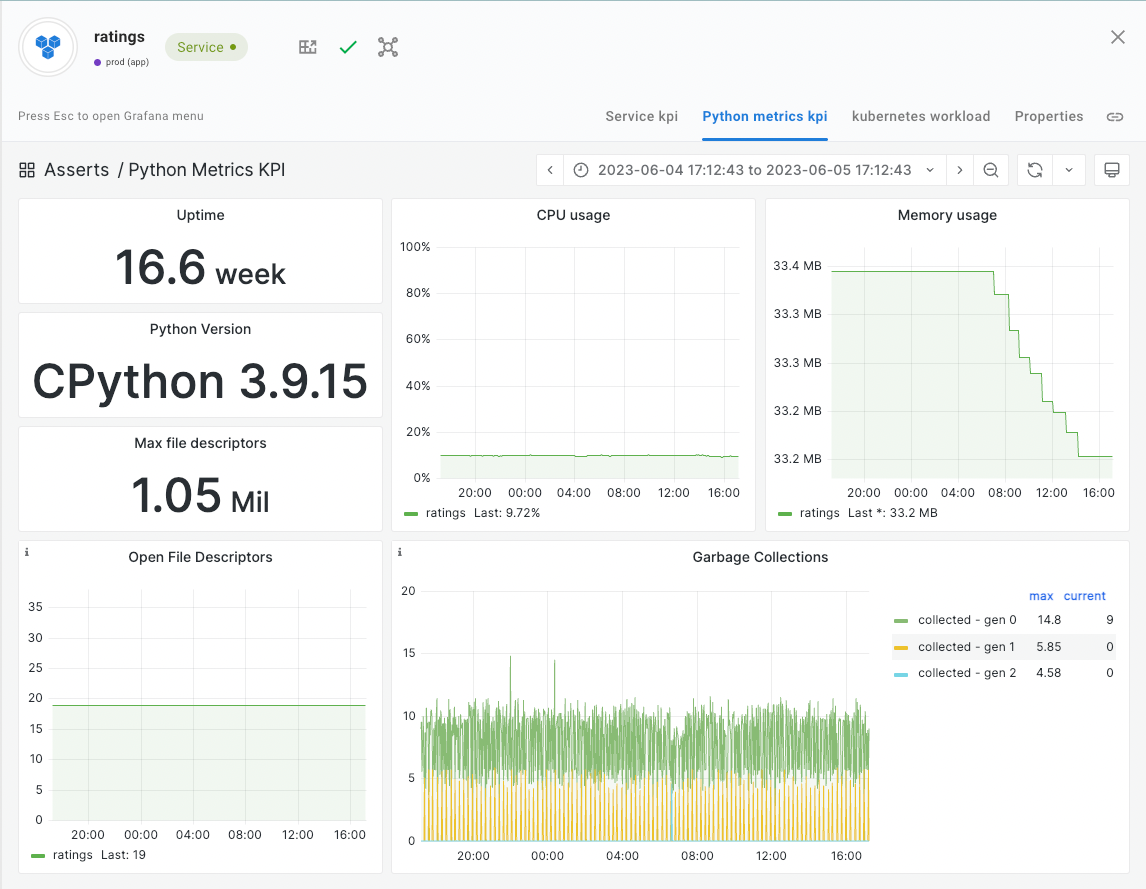
Alternatively, you could just install Asserts for free, forever and use the curated library of dashboards and alert rules, not just for Python but many other technologies too. Asserts Data Distiller takes the short term detailed data from Prometheus and keeps just what's important long term for reporting and analysis. As you deploy more applications, Asserts Entity Graph provides a full stack topology view and automatic correlation and collation when an incident occurs.