Finding And Fixing Common Kubernetes Problems
Kubernetes does a fantastic job of running and scaling application workloads. However, it can be tricky to find the source of problems when things don't go as planned.

Kubernetes provides a scalable and automated platform for running application components. It seamlessly takes care of numerous mundane tasks reliably and efficiently, ensuring that service levels are maintained with minimum operator input. However, a minor misconfiguration or some misbehaving code can cause problems that can be tricky to track down.
Nodes
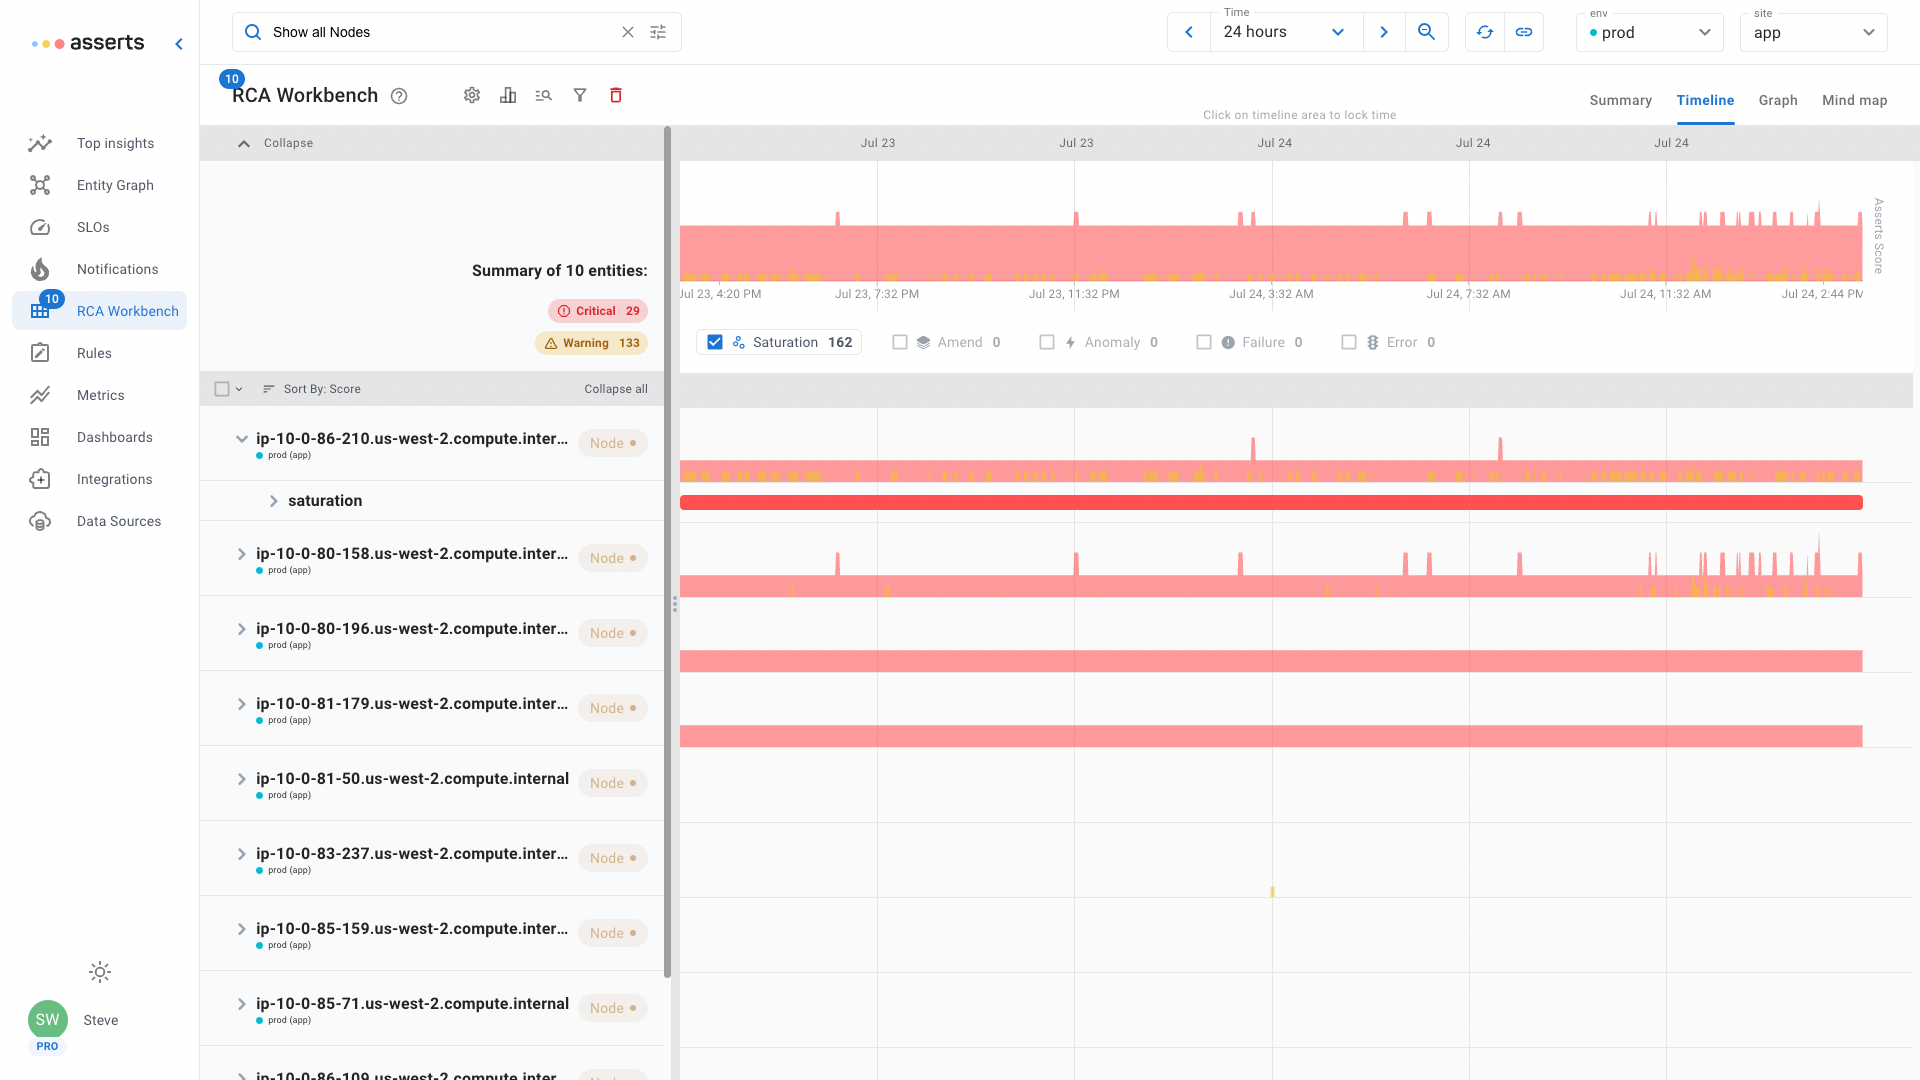
Kubernetes runs workloads on compute nodes, just like any traditional environment there has to be capacity available. Use the Show all Nodes natural language search in the RCA Workbench to easily see all available nodes. The default sorting order will place those with the most Assertions at the top. Use the filter to display just Saturation Assertions to see if any nodes are running short on resources.
Pods
Pods are where the application components run. A Pod runs one or more containers that do the work: program logic, data store, cache, etc. Kubernetes will attempt to keeps Pods running. If a container exits unexpectedly or becomes unresponsive, Kubernetes will automatically restart it to provide continuity of service. There are some situations that Kubernetes can not automatically recover from.
Crash Loop Backoff
When a Pod unexpectedly exits or is unresponsive to a liveness probe, Kubernetes restarts it. However, if the Pod continues to fail, Kubernetes will progressively extend the period between attempted restarts, this is called Crash Loop Backoff. Drilling down directly in context to the container logs will hopefully reveal something useful to help with finding the cause.
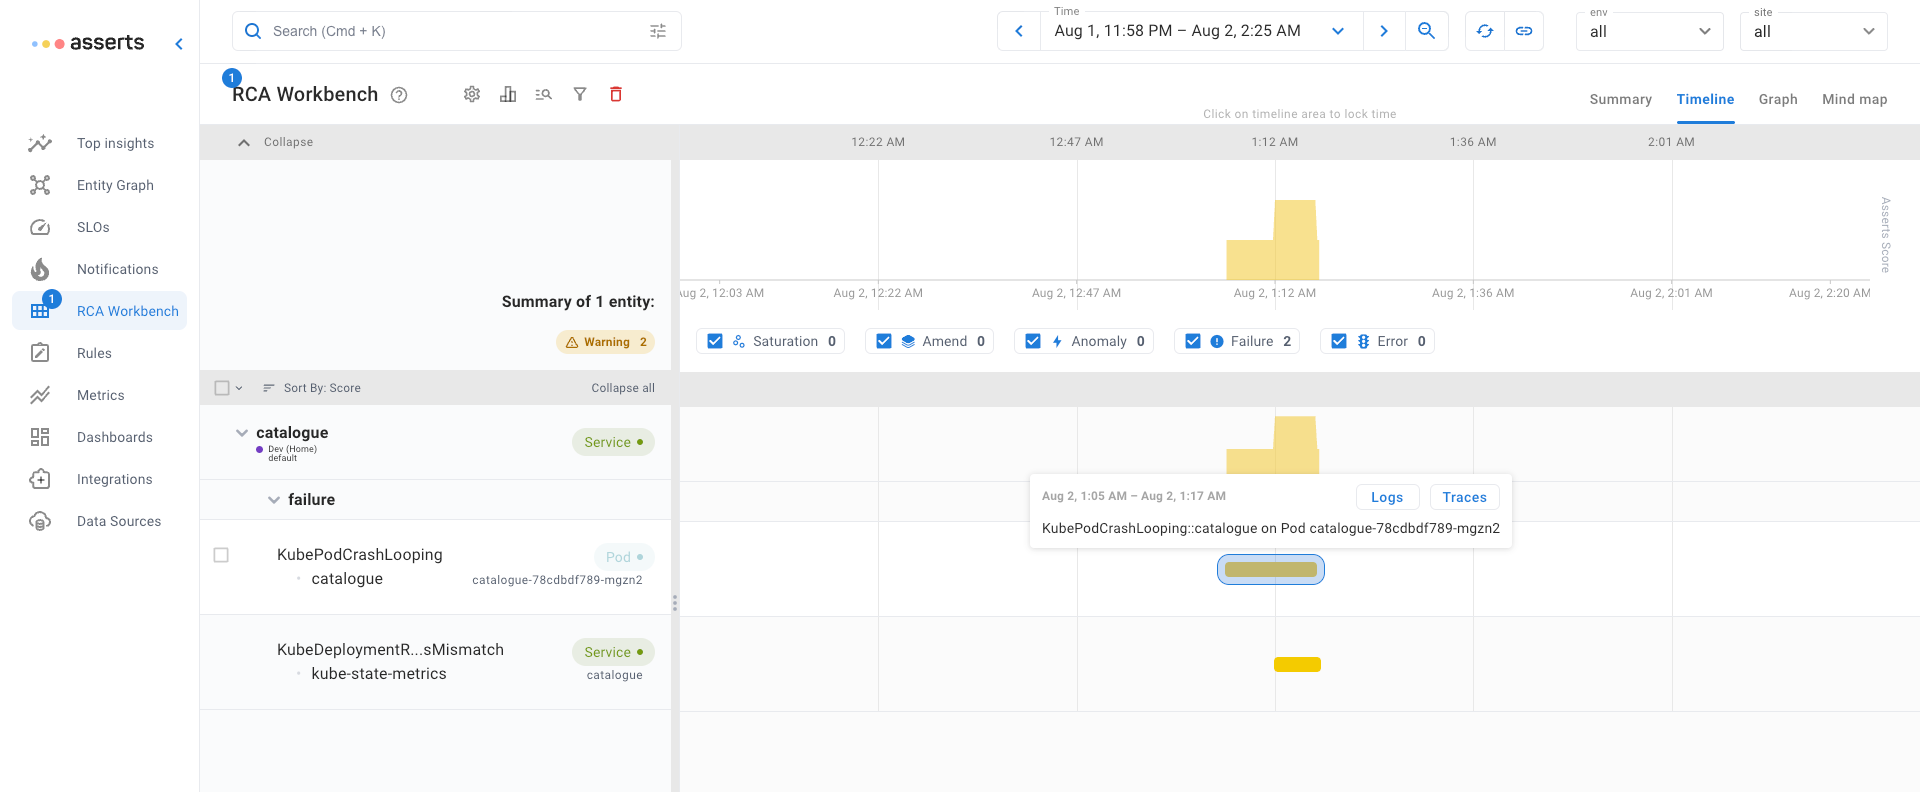
Image Pull Backoff / Image Pull Error
Kubernetes must pull the container images from a registry before they can be run inside a Pod. If it fails to pull the image (Image Pull Error) it continue to try while extending the period between attempts (Image Pull Backoff). This problem is usually down to a configuration mistake, the image name and tag or registry credentials being configured incorrectly.
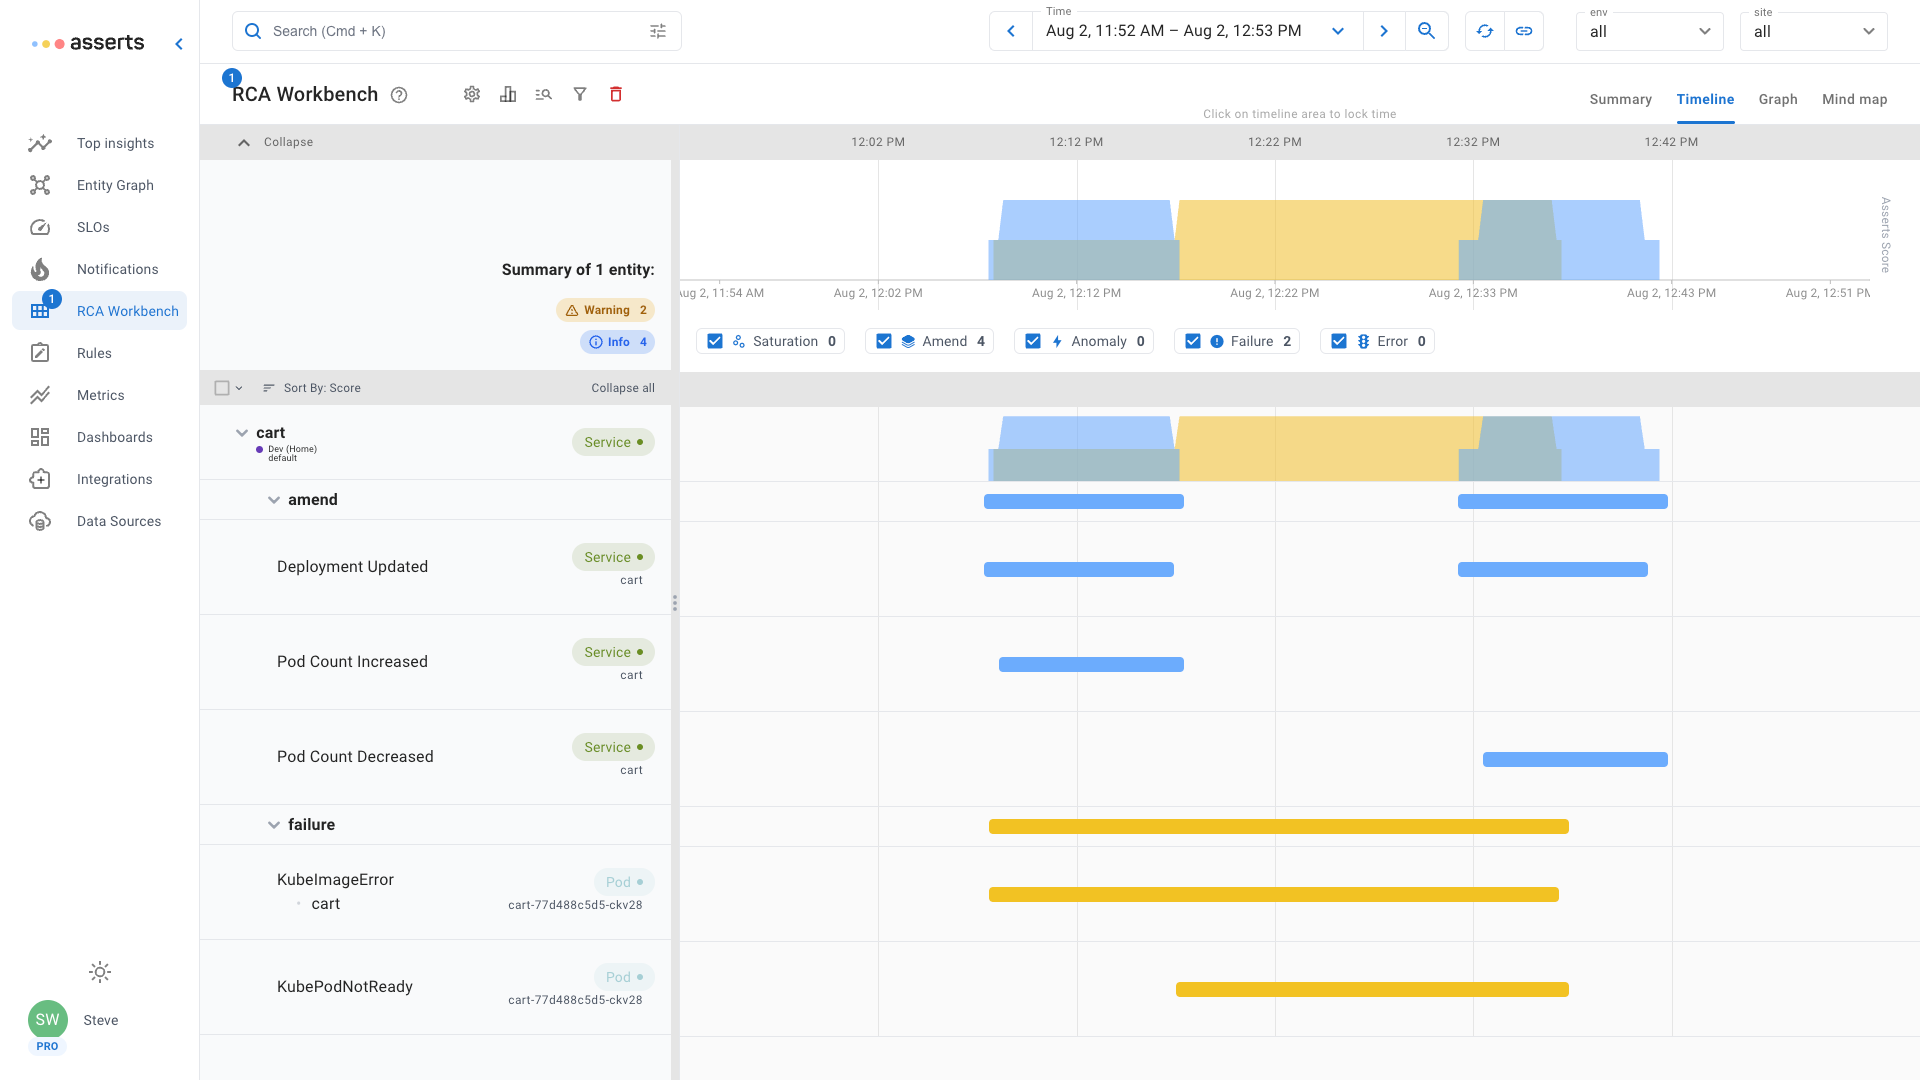
Asserts RCA Workbench shows the an amend Assertion when the Deployment was updated. Following that the failure Assertions for image error and pod not ready. Once the Deployment was updated again to fix the error, all Assertions cleared.
OOM Killed
Pods can be allocated with a limit set on how much memory a container can use. If a container attempts to use more than the configured limit, Kubernetes will kill it, Out Of Memory Kill. If a container does not have a memory limit defined, it can still be the target for an OOM Kill Container Limit Reached. When a node in a Kubernetes cluster is in danger of running out of memory, Kubernetes will OOM Kill a minimum number of Pods to prevent memory exhaustion, OOM Kill Limit Overcommit.
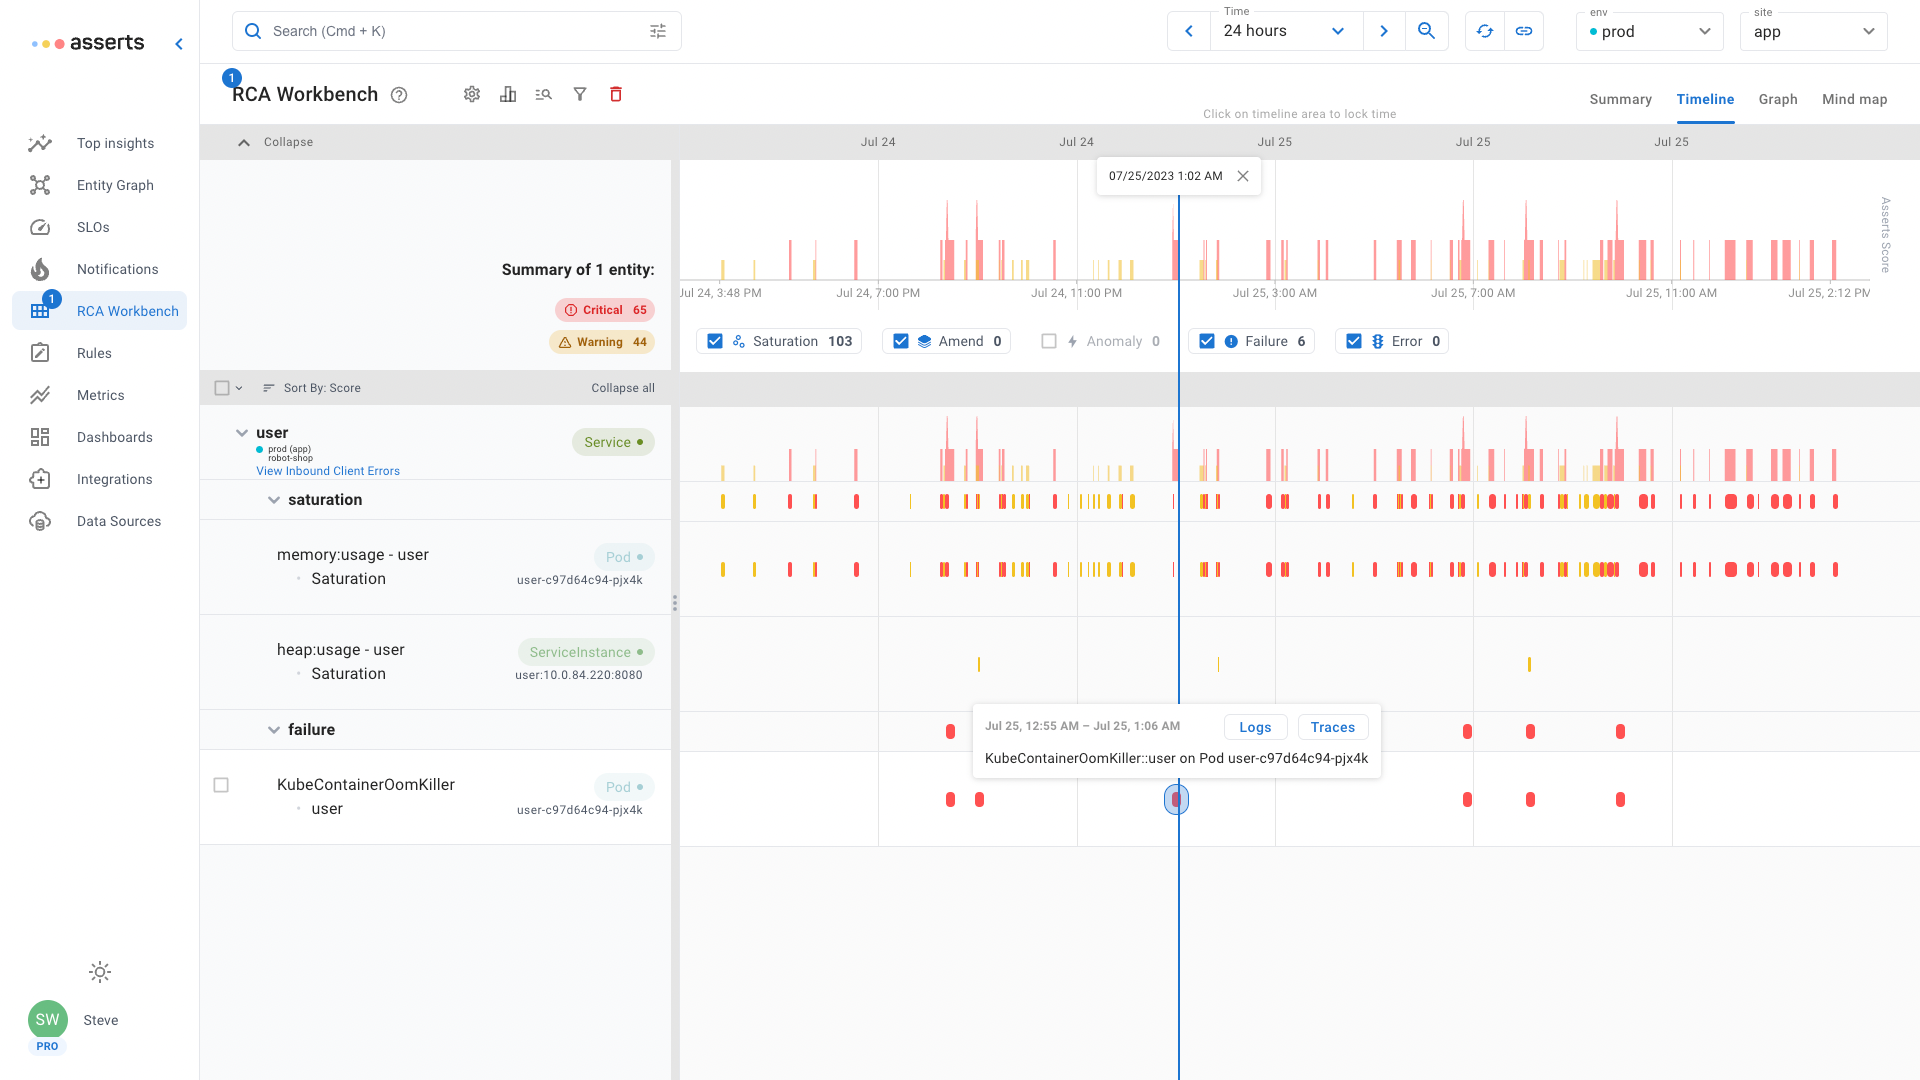
Asserts RCA Workbench shows that the user Pod has saturated both heap and container memory to the point that Kubernetes has periodically OOM Killed. Drill down in context to both the logs and traces for this Pod to investigate why the code is allocating too much memory.
Pending
A Pod may be created but not running, stuck in a Pending state. This can be due to misconfiguration or a lack of resources.
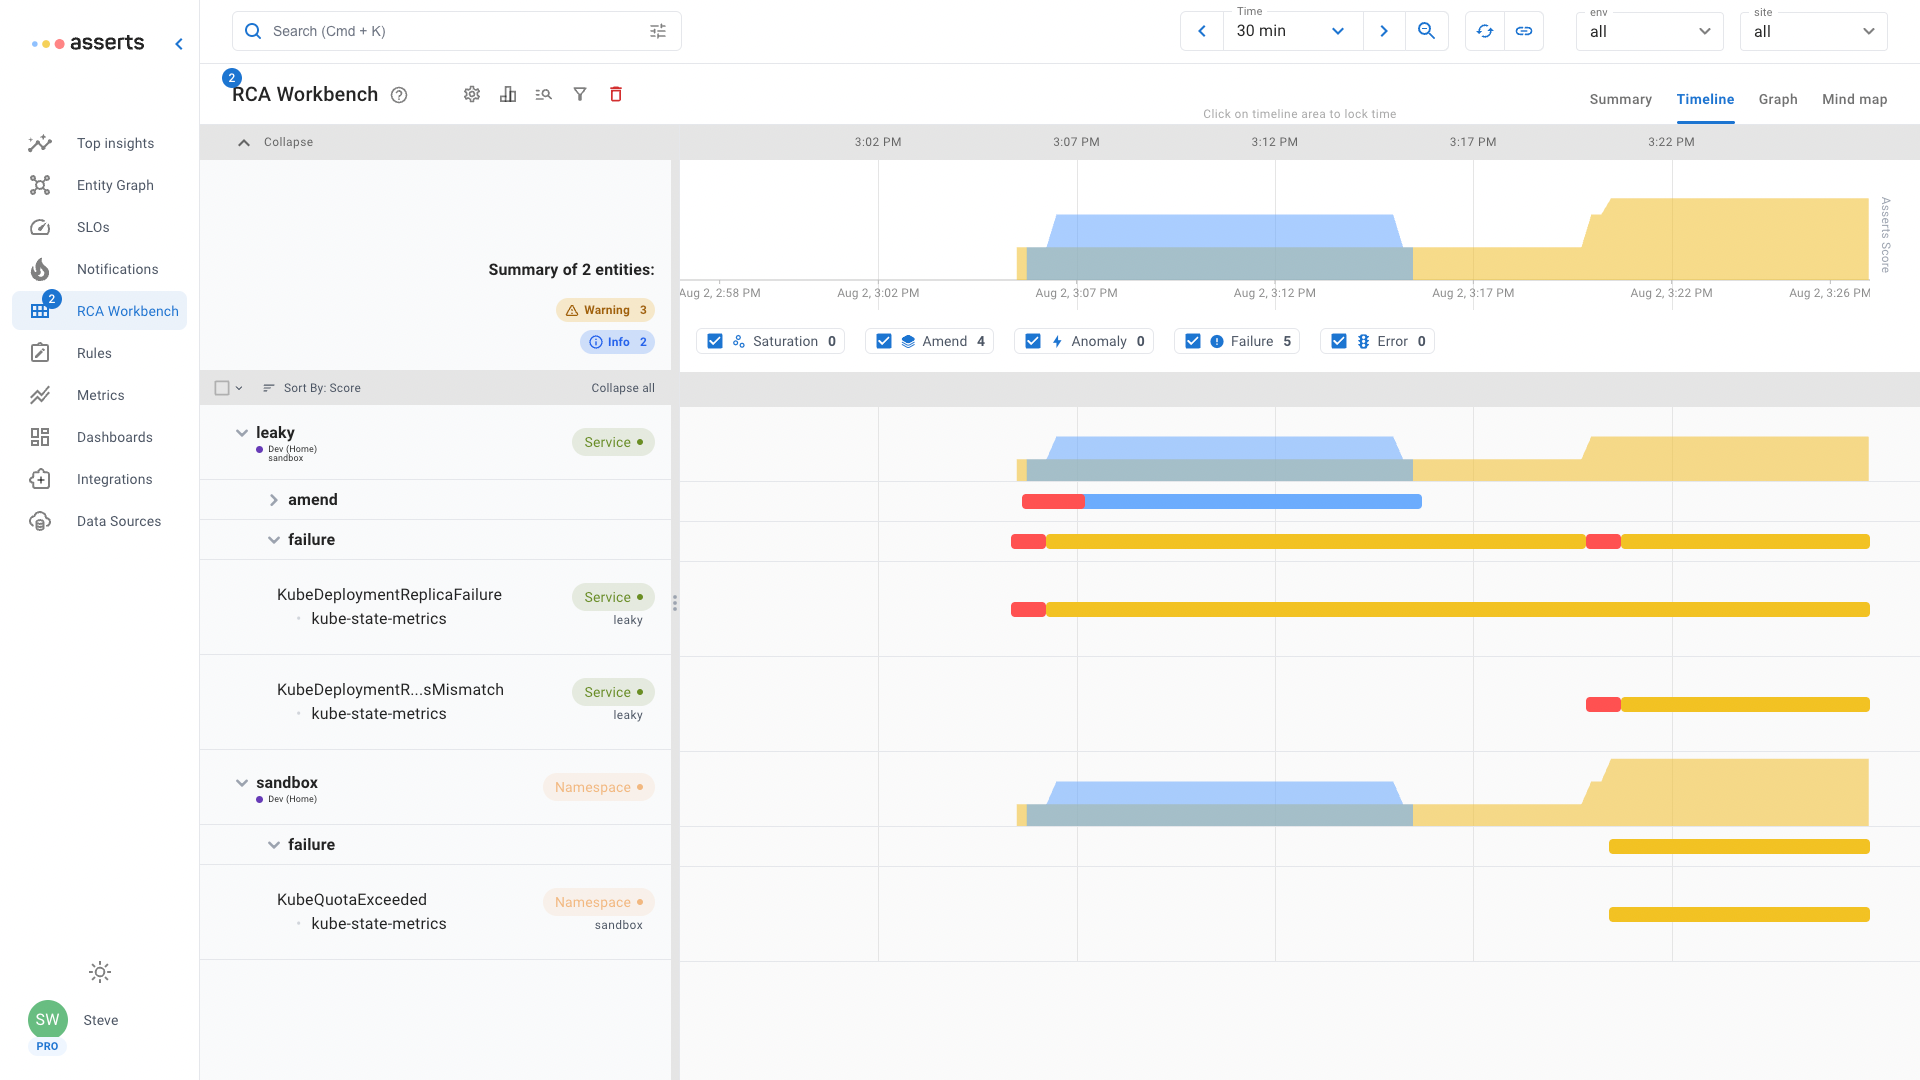
In the RCA Workbench example above, the leaky service has failed to increase the Pod replica count. At the same time it shows that the sandbox namespace containing the service has exhausted its resource quota. The extra pod replicas required are stuck in a pending state waiting for sufficient resources to be available. Misconfiguration is another way a Pod can get stuck in a pending state. For example a misconfigured reference to a ConfigMap, the Pod will be stuck until it can find the referenced resource.
Context Is The Key
Assert RCA Workbench automatically collates all the information engineers require to investigate problems with Kubernetes workloads. From this dynamic dashboard contextual information for interconnected services, nodes, detailed low metrics, logs and traces are all just a click away. This saves engineers valuable time by not searching for dashboards or crafting queries in obtuse syntaxes. It reduces the size of the incident response team because all the related information is in one place, no need to pull in other team members for their domain knowledge.
Try Asserts today for free, forever.