Prometheus Exporters and Libraries
Expanding Prometheus coverage of your applications is easy. Exporters can be added with just minor configuration changes. Adding client libraries for code coverage is just a few lines.

Once you have your Prometheus server up and running, whether it’s running inside your Kubernetes cluster or you’re using one of the cloud providers managed services. It’s time to start getting some metrics into it. Numerous CNCF projects expose a Prometheus metrics endpoint, for those technologies that do not expose such an endpoint, there is most likely an exporter that can be used. Finally a metrics endpoint can be added to your own services by including the matching Prometheus agent in your code. This article will show you how to add an exporter and include a Prometheus agent library in your code.
Exporter
For the exporter example we’re going to Nginx; one of the most popular Docker images. This exporter reads the data provided by Nginx HttpStubStatusModule and provides it in Prometheus metrics format on the specified port for scraping by the Prometheus server. Fortunately the Nginx Docker images already have this module compiled in. The following snippet should be added to the Nginx configuration to enable access to the status data.
location /nginx_status {
	stub_status on;
	allow 127.0.0.1;
	deny all;
	access_log off;
}
You can test that the configuration is working by using curl to get the location. Now that we have Nginx with status information available, the next task is to configure the exporter to use this. In a Kubernetes environment it is best practice to run the exporter as a sidecar; this is an additional container inside the same Pod.
apiVersion: apps/v1
kind: Deployment
...
    containers:
      - name: web
        image: nginx:1.23
        ports:
          - name: http
            containerPort: 80

      - name: nginx-exporter
        image: nginx/nginx-prometheus-exporter:0.11.0
        args:
          - '-nginx.scrape-uri=http://localhost/nginx_status'
        ports:
          - name: http-metrics
            containerPort: 9113
Because the exporter is running as a sidecar it shares the same network, therefore localhost can be used to access the Nginx status location. Both the regular HTTP port and the metrics port are included in the Kubernetes Service manifest, a ServiceMonitor is then used to tell Prometheus where to scrape.
All of this can be achieved with just minor configuration changes; this is also true of the other exporters. Making it easy for Operators to extend the reach of Prometheus metric collection beyond the usual Kube State Metrics and Node Exporter.
Client Library
Adding a Prometheus metrics endpoint to your own services is a little more involved as it requires some minor code changes. However, these changes are similar to that of commercial products such as Datadog and New Relic but with the advantage of being open and free from vendor lock-in. For this example we’re using a Python Flask application.
An extra library is required:
- prometheus-flask-exporter
This will provide metrics for both the Python runtime and any endpoints the service defines. The library just needs to be imported and initialised.
from prometheus_flask_exporter import PrometheusMetrics

def path(req):
    # Use the first URI segment
    return '/' + req.path[1:].split('/')[0]

app = Flask(__name__)
metrics = PrometheusMetrics(app, group_by=path)
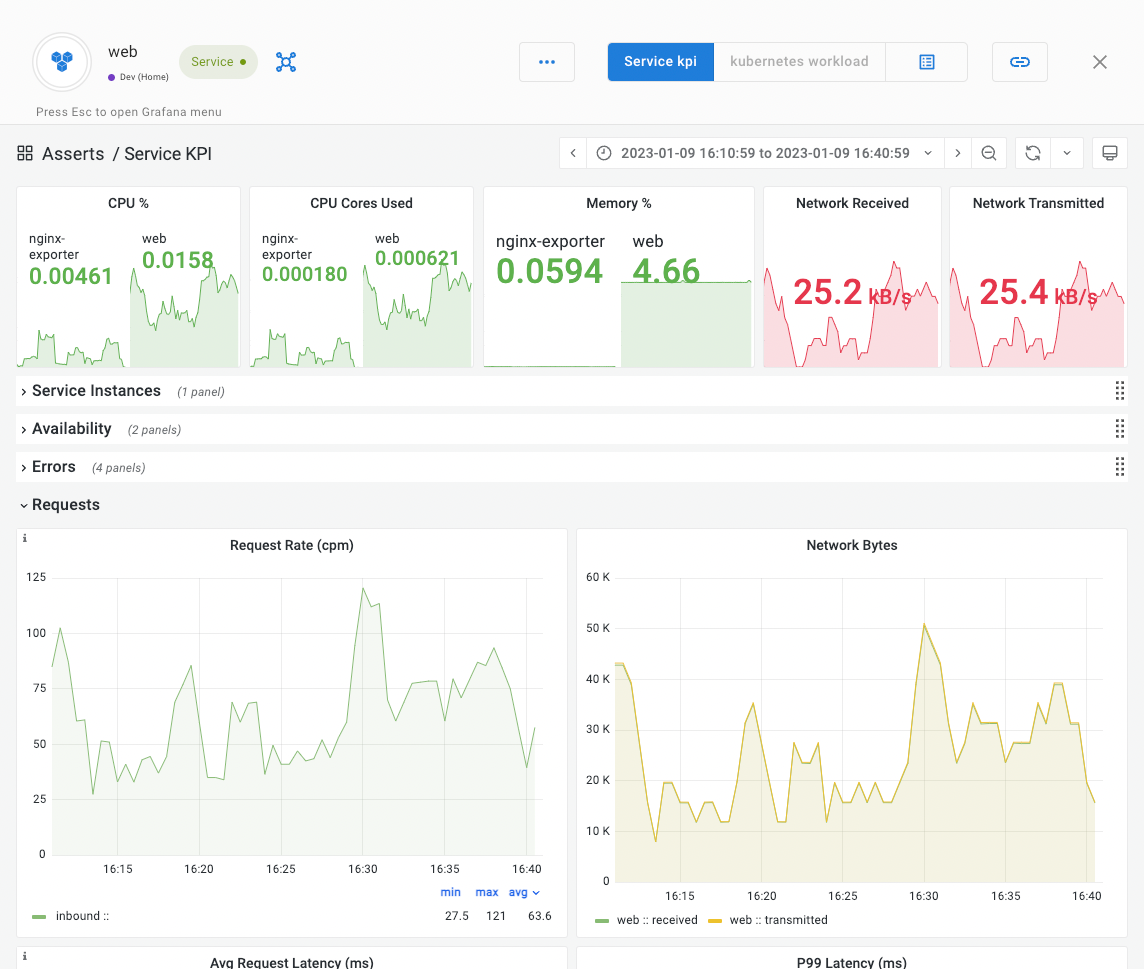
Not too complicated is it? A real implementation might have slightly more sophisticated logic for path grouping. Once the container is rebuilt and deployed you’ll be able to monitor both Python runtime activity such as garbage collection and RED (Rate, Errors, Duration) metrics for each endpoint. These metrics along with logs reduce the dependency on tracing and its associated high overheads of cost and compute.
More Metrics Equals More Value
A single Prometheus server is capable of handling up to around 10 million metrics, therefore there’s plenty of head room to add a multitude of exporters and agents. With all the components of your applications providing metrics it could become a bit overwhelming keeping on top of the copious amounts of dashboards and alert rules to provide actionable information out of all that raw data. This is where Asserts comes to the rescue! It provides a layer of intelligence and automation on top of your Prometheus data. The curated libraries of dashboards and alert rules relieves you of the constant toil of maintaining these resources. The Entity Graph automatically tracks entity relationships over time to intelligently group alerts into contextualised informative notifications, significantly speeding up the time to root cause identification.
To see Asserts in action with your data, sign up for a free trial.