Speed up RCA by Going SLO
Once you stop fretting over each individual service, you should change your monitoring strategy accordingly. Your primary consideration becomes making sure your application is processing requests in a prompt and error free manner.

Service Level Objectives
A Service Level Objective (SLO) specifies a level of performance to be achieved over a period of time. The level of performance is specified by a Service Level Indicator (SLI). Typically one of the Golden Signals is used for an SLI. A typical example is the P99 response time of one or more of a service’s endpoints e.g. authentication service /login. That SLI is then used as part of the SLO definition where a target is set for a period of time. Continuing the example, the average response time for login should not exceed two seconds over a seven day period.
Traditionally SLO definitions are driven by Service Level Agreements which are contracts for service between businesses; typically with financial penalties for breaches.
Outside of the formal arrangements of SLA and SLO, there are benefits to using SLOs, especially with Kubernetes and microservices.
Pet vs Cattle
Microservices deployed in Kubernetes clusters sort of look after themselves. If a service becomes unresponsive, Kubernetes will kill it and start a new one. Similarly using Horizontal Pod Autoscalers (HPA) if a service becomes saturated, Kubernetes will start additional instances to take up the load. This enables you to treat your services more like cattle, not fussing over each individual one, rather than as precious pets whose every whim you indulge.
Once you stop fretting over each individual service, you should change your monitoring strategy accordingly. Your primary consideration becomes making sure your application is processing requests in a prompt and error free manner. The broad application of SLOs becomes your starting point, rather than scrutinising compute resource utilisation of each service instance.
Operationalising SLOs
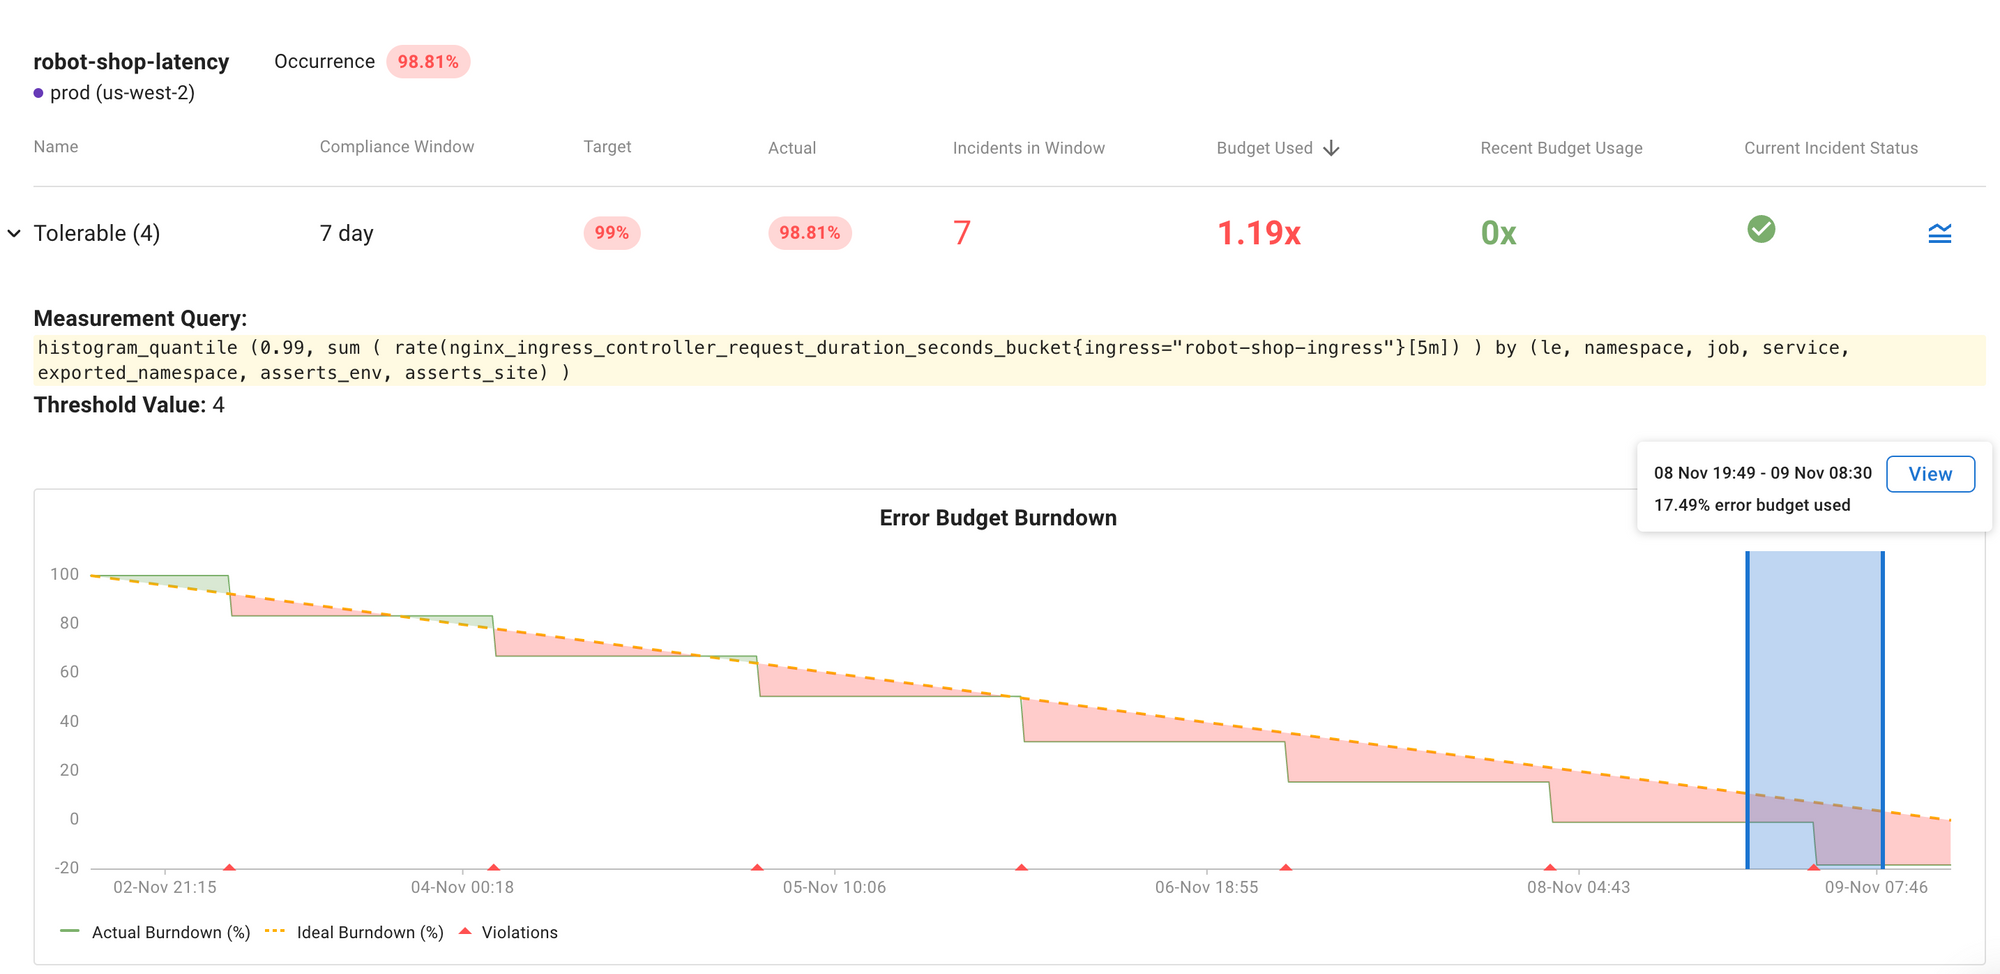
It’s easy to define SLOs with Asserts, either via the user interface, rest API or via a Custom Resource Definition (CRD). Using the CRD allows SLOs to be managed and deployed with regular CI/CD workflows.
To define an SLO first select whether it’s for prompt or error free services; in other words, request latency or error percentage. Next, select the target service or services and optionally endpoints of those services. Typically you’ll want to exclude the readiness and health check endpoints because they can skew the data. A historical graph shows the appropriate metrics to help you choose a realistic target for the SLO. Because Asserts SLOs can span multiple services and endpoints they can be aligned to business objectives, for example, e-commerce successful checkout.
- Cart /checkout
- Shipping /select
- Payment /pay
This concept can be expanded with the use of custom business metrics, Prometheus recording rules are used to create these. For example, the ratio of successful calls to Cart /checkout and Payment /pay provides an indication of successful completion of e-commerce transactions.
Finally, one or more objectives can be defined, specifying the period of evaluation, the threshold and the target for compliance.
- Prompt: Weekly - 7 days - 3 seconds - 98%
- Error free: Monthly - 30 days - 99%
From SLO to RCA
Asserts generates an alert each time SLO budget burndown deteriorates. These are the only alerts you need, free yourself from alert fatigue by silencing all those resource alerts; only get notified when it really matters. Go straight from the SLO burndown event to root cause analysis.
Because Asserts has the Entity Graph it knows which services are related to the SLO breach; it’s more than just time-based correlation, eliminating false positives and improving the signal-to-noise ratio. Just the relevant data is presented along with in-context links to your existing log aggregation solution. Asserts also provides a curated library of Grafana dashboards directly linked in context. Root cause analysis has never been so easy.
Start Using SLOs Today
SLOs are not just for SLAs. Using SLOs around your microservices eliminates the constant noise of too many alerts, instead only notifying you when there’s an incident that affects the quality of service for your customers. Asserts Entity Graph automatically groups all service instances that are associated with the SLO breach together on the RCA Workbench, enabling DevOps and SRE to quickly and efficiently perform root cause analysis without any irrelevant distractions. Go SLO to go fast.
Take a peak by browsing our tour, trying it out in our sandbox environment or sign up for a free trial to test it out with your own data.
