Observability - Build vs Buy
The requirement to observe and monitor modern distributed applications is no longer in question. The question is how to acquire that capability, build it or buy it?

The fact that modern distributed applications require observability is no longer in doubt, it is impossible to effectively operate such systems without it. The question facing organisations today is whether to build or buy an observability platform. Until recently only the most technically adept organisations would consider the build option. However, because of intense competition between cloud providers and maturing open source tools, it has never been easier to assemble an observability platform with the potential for substantial cost savings.
Buy
The primary perceived benefit of buying or subscribing to a commercial observability platform is convenience. Sign up and the backend is instantly available, ready to receive data and the ongoing operation is taken care of. However with great convenience comes great cost. Additionally, not all the work is taken care of, there is still plenty of work to do setting up agents to collect and forward data and instrumenting code to provide tracing. Then once the data is flowing there is yet more work required to configure alerting rules and build dashboards for visualisation. Subscribing to a commercial platform is not without some toil.
Build
A core observability platform consists of metrics, logs and traces integrated to enable quick and easy navigation across data types. For example, going from investigating metrics for a container to inspecting its logs then analysing any traces that passed through it.
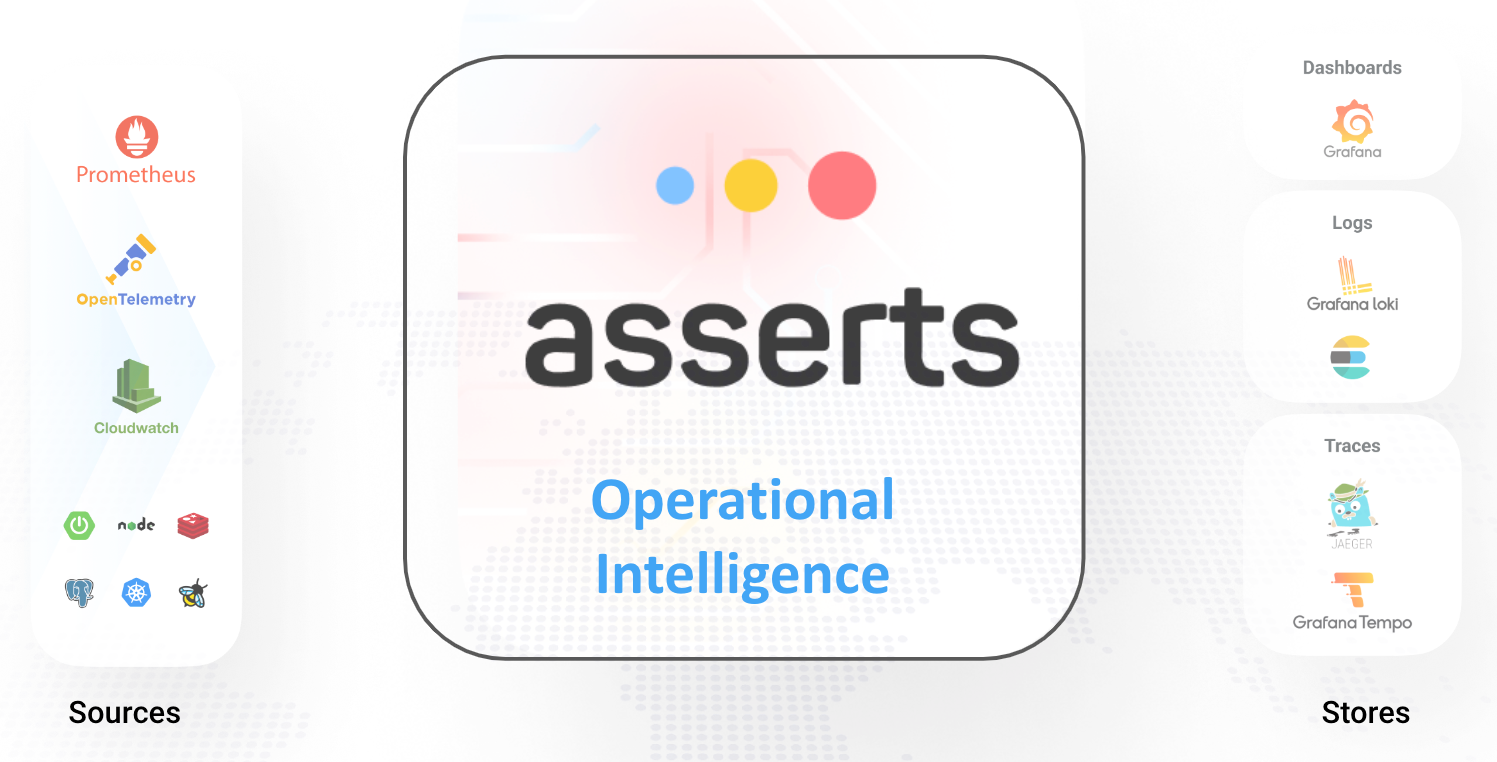
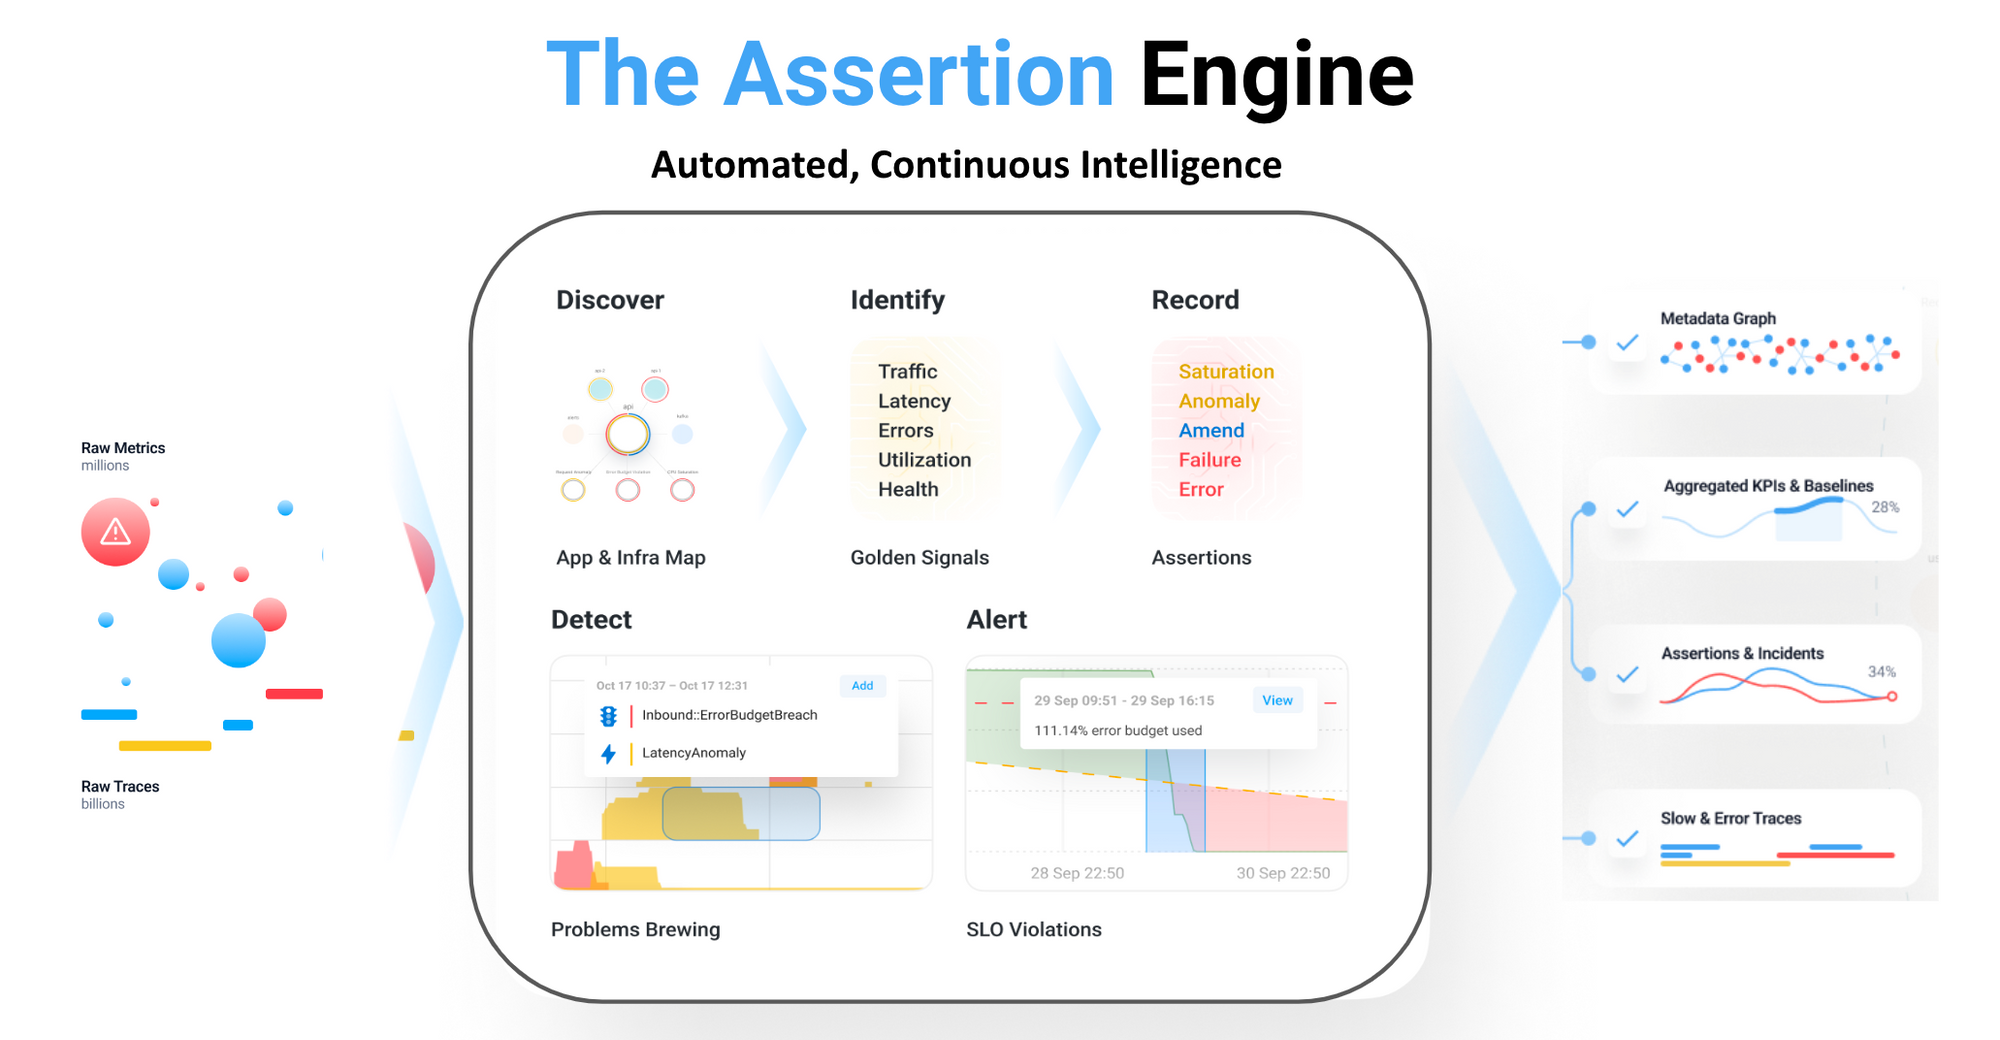
Asserts adds a layer of automation and intelligence on top of established open source tools, unifying data silos and providing automatic correlation between application components via the Entity Graph. When an incident is triggered, the Entity Graph is traversed to collate all application components together onto a single dynamic dashboard. All the information engineering teams require is just a click away.
Metrics
Prometheus has become the open source de facto standard for time series metrics. It offers comprehensive support for various technologies with a rich library of exporters and client libraries. These offer a more extensive set of metrics than the commercial equivalents with no limitations on custom metrics. Prometheus can be used with a remote write configuration where it just performs the metric collection then forwards them to a remote endpoint. Similarly, Victoria Metrics offers their vmagent which is optimised for remote write operation. Utilising remote write configuration consumes minimal resources locally. Both Prometheus and Victoria Metrics can be deployed for high availability where multiple instances are running collecting the same metrics with deduplication handled on the backend.
Asserts SaaS provides an endpoint for remote write with no limit on the number of metrics. All metrics are retained for 28 days then distilled metrics are retained for 13 months. This provides full visibility for troubleshooting incidents as well as long term reporting and analysis.
Logs
Logging is as old as the hills and most organisations have already implemented a logging solution; there’s nothing new here. For greenfield sites that have not yet implemented a logging solution, there’s plenty of choice available from a wide variety of vendors in both open source and managed cloud offerings; Graylog, Grafana Loki, and Elastic Search, to name a few.
Traces
Open Telemetry provides an extensive collection of code instrumentation for many languages and frameworks. It has become so popular that the commercial observability tools readily accept traces in this format. Using Open Telemetry for metrics and tracing eliminates vendor lock-in. Metrics can be sent to Prometheus, and traces can be sent to any backend with just a minor configuration change; Jaeger, Grafana Tempo, AWS X-Ray, Google Cloudtrace, and many more.
Tracing produces vast amounts of data, it’s equivalent to structured logging at DEBUG level with every call to a service endpoint producing multiple spans. The huge amount of tracing data consumes compute, storage and network resources making it costly to operate. Trace sampling is used to reduce the data volume and hence reduce costs. Typically sampling is performed at the collection point and uses a configured percentage e.g. 10%. This is a blunt instrument which does not discriminate between good and bad requests.
Asserts Data Distiller includes an OpenTelemetry collector performs the trace sampling at the collection point; it uses baseline data from the Asserts backend to discriminate between good and bad requests. Therefore only traces from requests that are slower than normal or erroneous are sent to the backend. This reduces tracing data volume by at least 90% and ensures that the collected trace data is useful for identifying issues. With the reduction of trace data comes a matching reduction in resource utilisation and associated costs.
With the volume of tracing data squashed by Asserts Data Distiller, it is possible that it may even fit within the free allowance of SaaS trace storage. For example, AWS X-Ray includes 100,000 free traces each month, with Asserts Data Distiller, that’s approximately 1 request per second 24 x 7 for free.
Start Building Now
Using open source observability tools together with Asserts it’s easy to assemble an observability platform and save 70% compared to traditional commercial APM. To see what Asserts can do, install it today for free, forever.