Better, Faster, Cheaper
Operational Intelligence
With Your Prometheus and OpenTelemetry stack

The Problem
Observability is Mandatory yet Expensive
-
Data collection is easy, but analysis is human intensive
Teams struggle to keep up with the context of each metric and must manually correlate signals through time and causality.
-
Raw metrics & traces are insightful but expensive to store
Vendors hijack your data and charge you for ingestion leaving you stuck with an out of control Observability bill!
-
Figuring out what to retain for how long is a constant battle
Deciding which data needs to persist in long term storage is a full time job.
The Solution
Introducing Asserts Observability
A layer of automation and intelligence leveraging your open source observability data that lowers costs AND improves visibility.
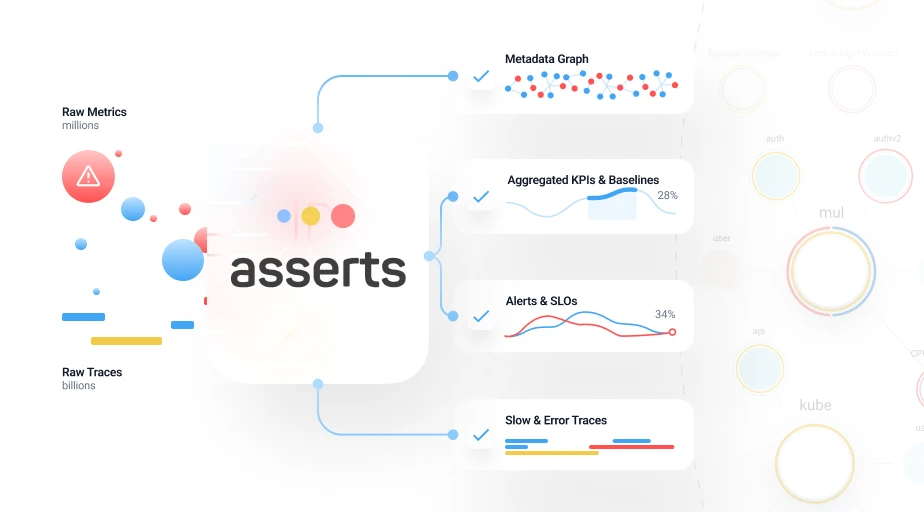
Asserts Intelligent Workbench™
Curated library of PromQL recording & alert rules and an intelligent OpenTelemetry Collector will continuously analyze millions of metrics and live traces to spot issues instantly. No dashboard assembly required.
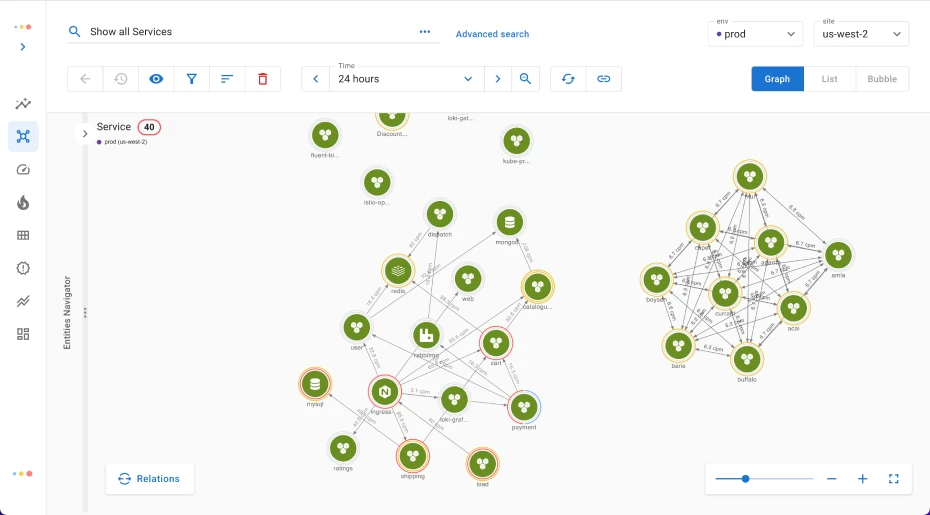
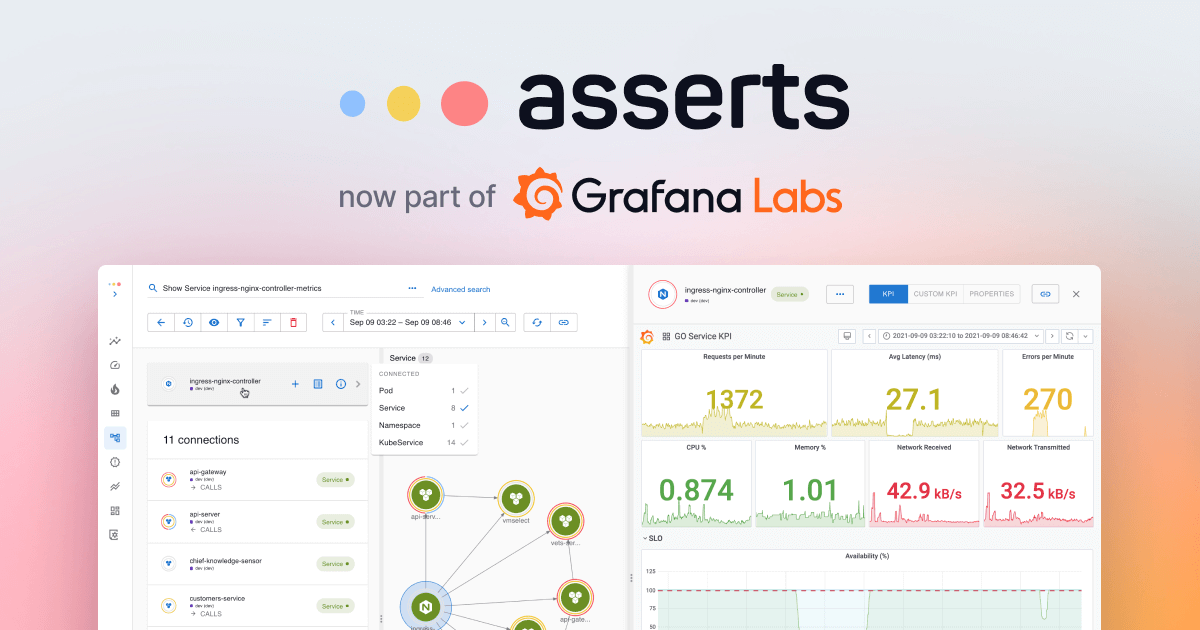
Asserts Correlation Intelligence™
Entity Map built from metadata collected from metrics, traces and an eBPF probe leverages Graph Inference to correlate issues and direct your attention to where it’s needed most.
Asserts Data Distiller™
Drastically reduces ingestion & long term storage cost by:
- Recording Traffic & Resource baselines, anomalies and alerts
- Retaining traces of interest based on statistical baselines
Become a Root Cause Guru
-
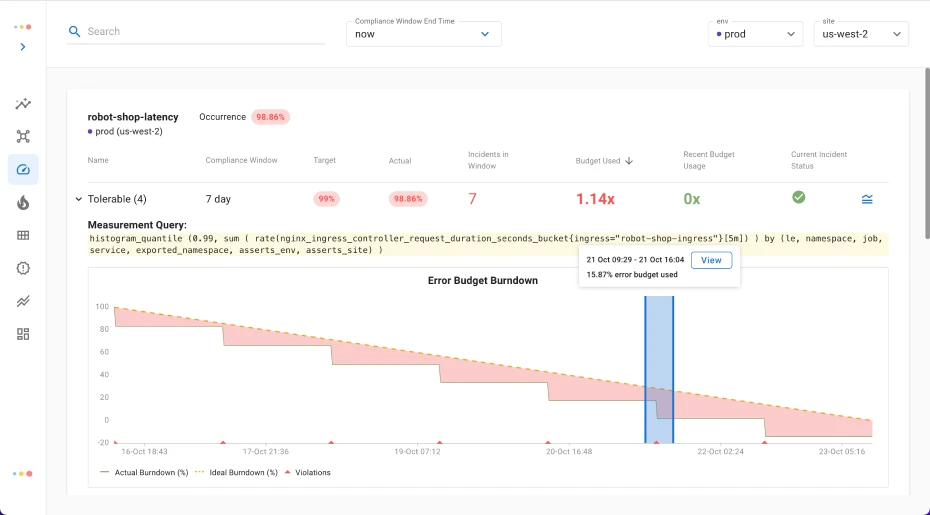
Track your availability with SLOs
Immediately see which SLOs are in danger of breaching and find out why your error budget is depleting by simply clicking into the Assertion Workbench directly from the SLO dashboard.
-
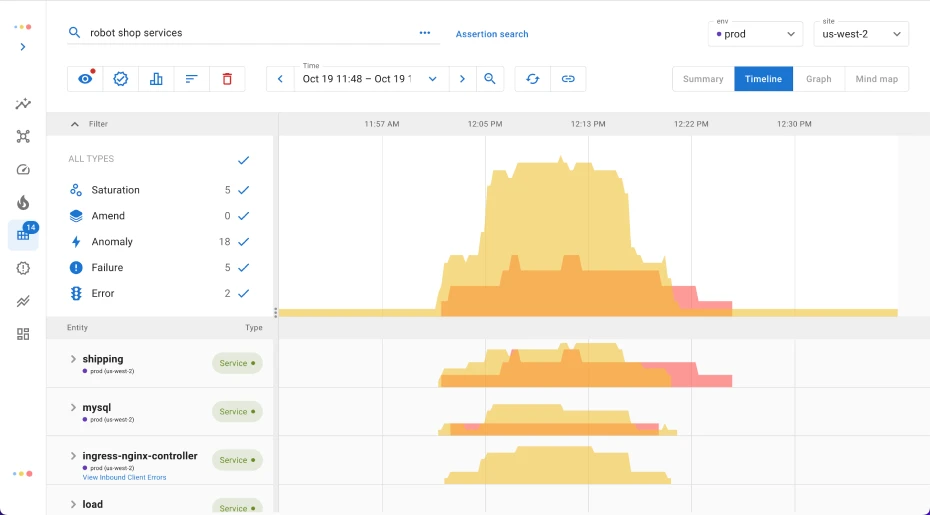
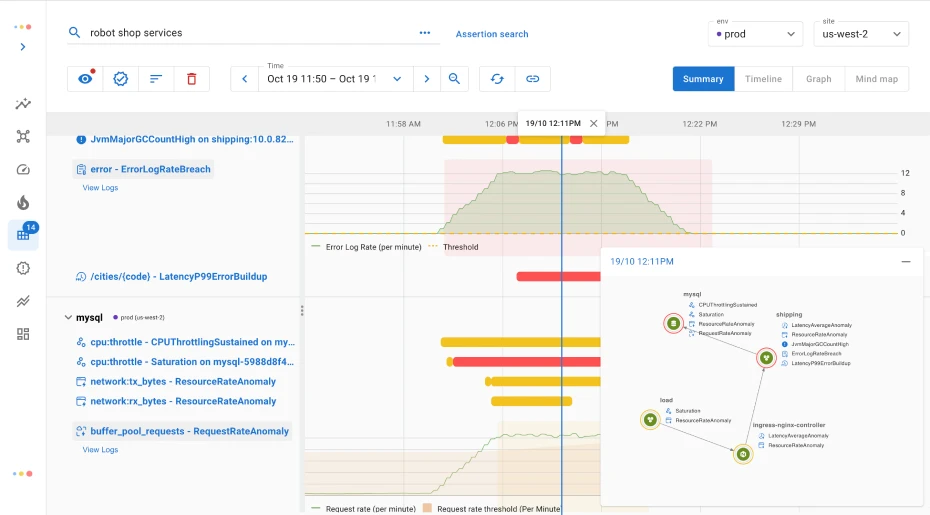
Leverage Asserts RCA Workbench
Asserts continuously correlates resource Saturations, code & config Amends, request & latency Anomalies, Failures, and Errors on your golden signals and health metrics so you see everything impacting your SLOs.
-
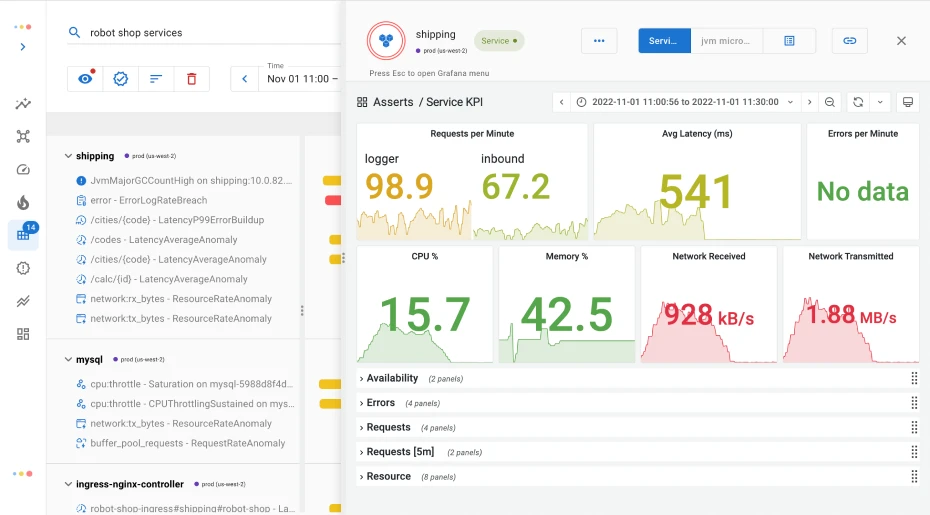
No need to build hundreds of dashboards
Click straight into the dashboard you need with the context of the issue you’re viewing - no need to manually create and maintain hundreds of dashboards or learn domain-specific query languages.
Automated Intelligence
For Prometheus & OpenTelemetry Stack
Retain what's meaningful
Avoid Vendor Lock-in
Maximize Your OSS Investment
Tame Your Observability Costs
Recent blog posts