Service Level Objectives and symptom-based alerting, part 2

In the previous post in this series, I explained why alerts should be based on the user-visible symptoms of problems rather than on problem causes. A quick recap: it is extremely hard to reliably alert on all the possible failure modes of a complex system, so a cause-based alerting strategy likely has some gaps. But it is especially in complex systems where reliable alerting is most needed.
If you're already familiar with service level objectives, you've likely heard about service level indicators. An SLI is a metric that captures some aspect of the system's performance. Availability and latency are common examples, and for simple web applications, those two measurements may be sufficient to implement an SLO-based alerting strategy. Most HTTP load balancers expose metrics like the number of successful requests and the number of total requests (the ratio of these two measures availability) as well as request latency. But what if your application is more complicated than that?
For example, let's consider a simplified version of the data pipeline application I described in the first post in this series. Our simple pipeline exposes two HTTP endpoints: one for feeding data into the start of the pipeline, and another for reading the output from the other end. This toy example accepts numbers as input, and outputs the mean of these numbers. Internally, the application does its calculations asynchronously: the input endpoint just writes numbers into a buffer, a periodic task takes the numbers out of the buffer, computes their mean, and writes the result into an output buffer, and finally the output endpoint reads from the output buffer. This is a silly architecture for such a simple calculation, but you could imagine more time and resource intensive computations where this architecture is reasonable.
Let's get back to our SLIs. Suppose that our goal for the data pipeline is for numbers dropped off at the input end to be processed and reflected at the output end within one minute. As long as this goal is met, we consider the system to be available. Would measuring the ratio of successful HTTP requests be sufficient to determine whether or not the system is meeting this goal? No, because in this example, the periodic task that computes the output data is a key part of the system. Suppose this task fails, takes too long, or doesn't run at all. You won't be able to tell if these problems are happening by looking at HTTP status codes alone. To more accurately measure whether the application is behaving properly, we need to change the application so that it exposes more data.
In the following code examples, I'm using the official Prometheus Python Client to push some additional metrics about the asychronous computation and make the application more observable. Here's the function that calculates averages:
REQUEST_TIME = Summary('aggregation_seconds',
                       'Time spent aggregating a stream',
                       ['stream_name'])
GAUGE = Gauge(
    'stream_aggregated',
    'timestamp when aggregation process last completed',
    ['stream_name']
)


def aggregate_inputs_for_stream(stream_name, timestamp):
    """Compute the average of numbers received for a stream in a minute."""
    with REQUEST_TIME.labels(stream_name=stream_name).time():
        input_numbers = _input_buffers_by_stream[stream_name]
        average = statistics.mean(input_numbers)
        _write_to_output_buffer(stream_name, timestamp, average)

        GAUGE.labels(stream_name=stream_name).set_to_current_time()
The aggregation_seconds summary allows us to calculate the average latency of the aggregate_inputs_for_stream function using PromQL:
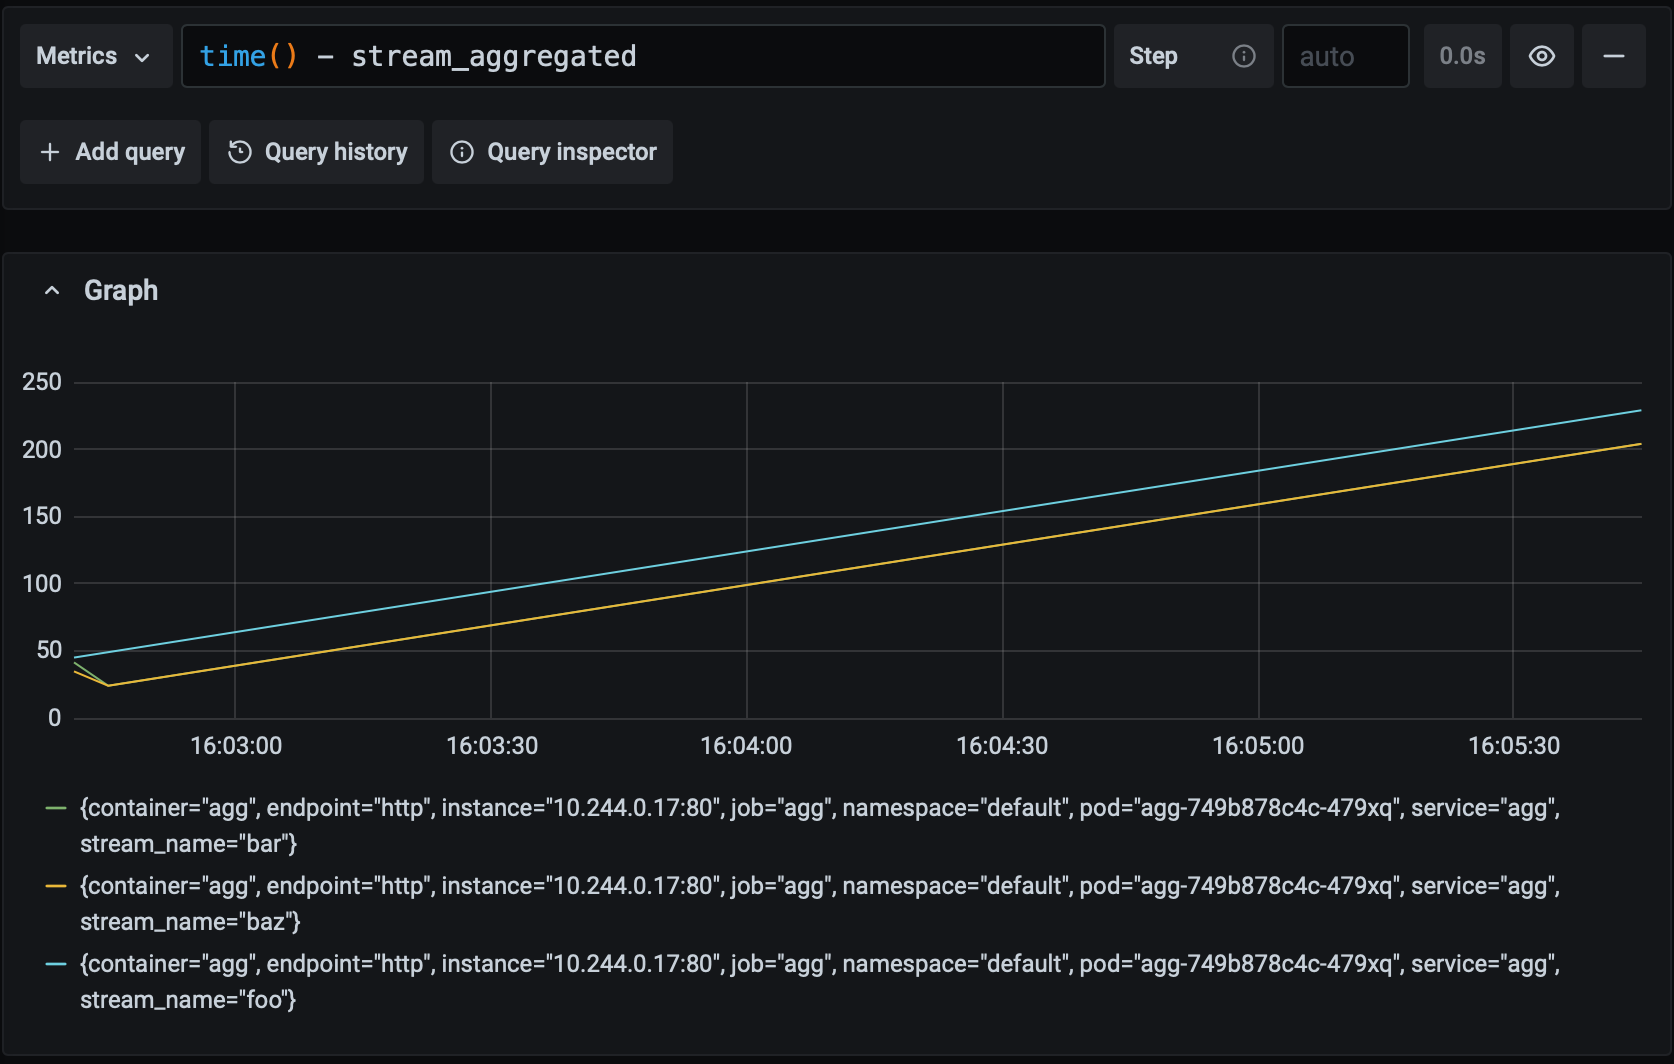
rate(aggregation_seconds_sum[1m]) / rate(aggregation_seconds_count[1m])The stream_aggregated gauge metric, on the other hand, describes when a stream was last aggregated via a Unix timestamp ( set_to_current_time causes the gauge to take the value of the current timestamp). This metric may seem a little unusual but it measures what we actually care about – how long it's been since the periodic task has finished successfully – quite accurately. In normal operation, the value of this metric will steadily tick upwards as the task runs. If something goes wrong, then the value will remain frozen, indicating the last time the task successfully finished. Let's combine this metric with PromQL's time function to graph the time since the last successful aggregation over time:
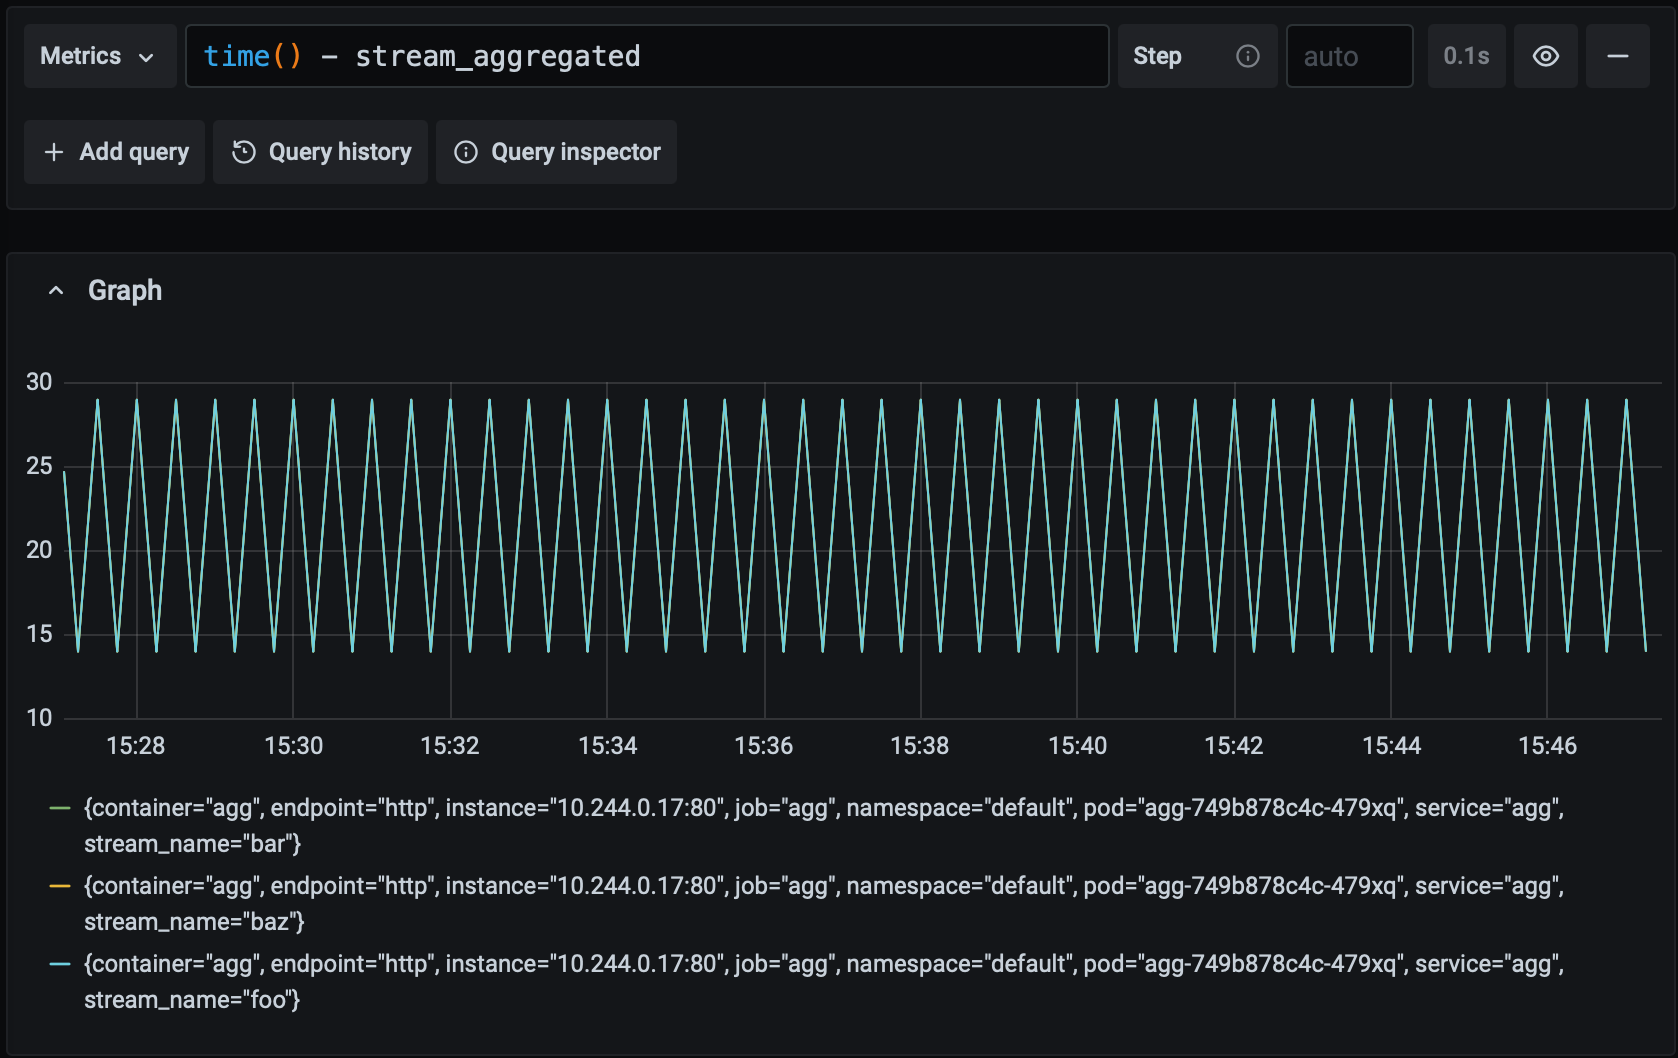
Recall that our goal is for any pipeline input to be aggregated and available as ouput with 60 seconds. Since the value of this metric never climbs above 60 in the graph above, we know that we're meeting our goal. Let's see what it looks like if the system starts experiencing a moderate amount of latency:
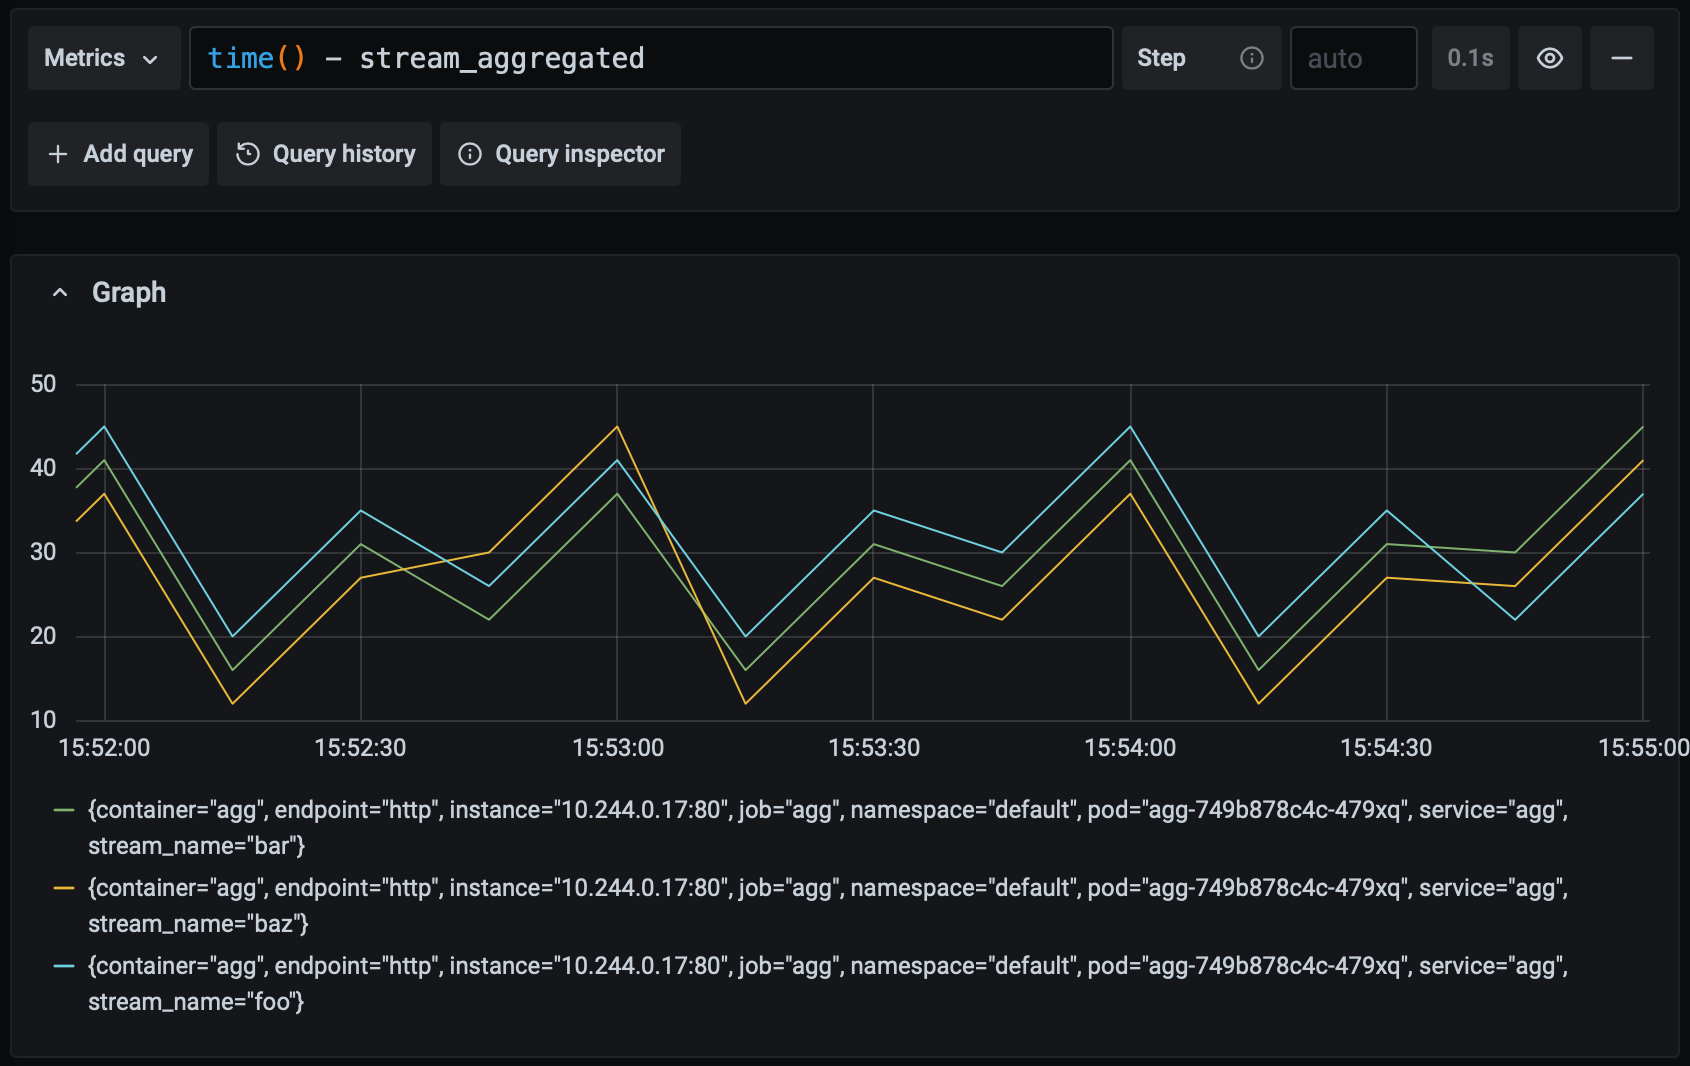
The maximum value of the metric has increased but it remains under 60, so while the application is slowing down it is still meeting our goal. What happens if the latency gets worse?
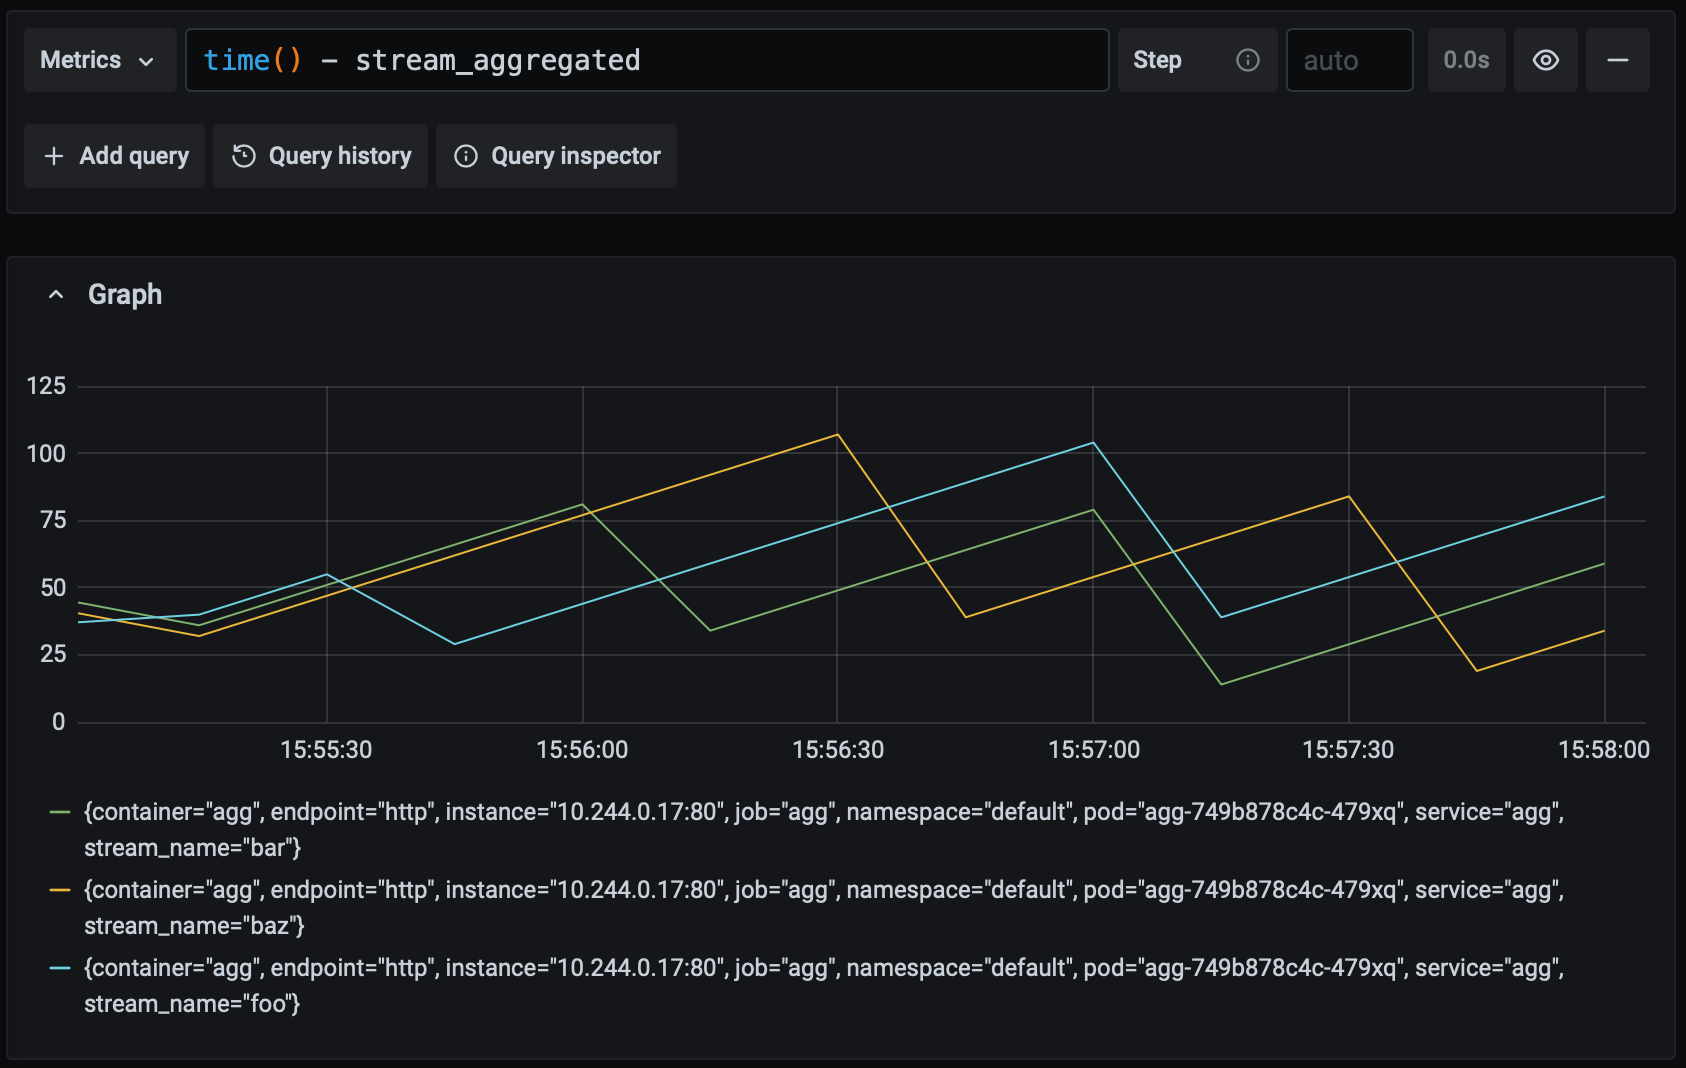
At this stage, we're falling short of our goal and we'd probably want to alert a human to investigate. Suppose something really goes wrong and the periodic task stops running entirely. This is what that looks like:
The great thing about this alerting approach is that we don't need to care why the task hasn't finished on time; we know that a problematic symptom has appeared and we need to start investigating the problem. We can be confident that any alerts we receive are real problems, and that there aren't any gaps in our alerting. This is the strength of alerting on symptoms rather than causes.
Compare this approach with an alternative: measure the latency of the periodic task and alert if it exceeds the 60 second threshold. If the application experiences a latency spike, this alert would work as intended and get our attention. But what if the task throws an exception and bails out before finishing? We'd need another metric and alerting rule to catch that possibility. Would these alerts fire if the job stops running entirely and there's no latency nor success rate data? The answer to that questions likely depends on the details of how you've configured the alerts. But if you get it wrong, you could miss an outage entirely. That's the trouble with alerting on causes.
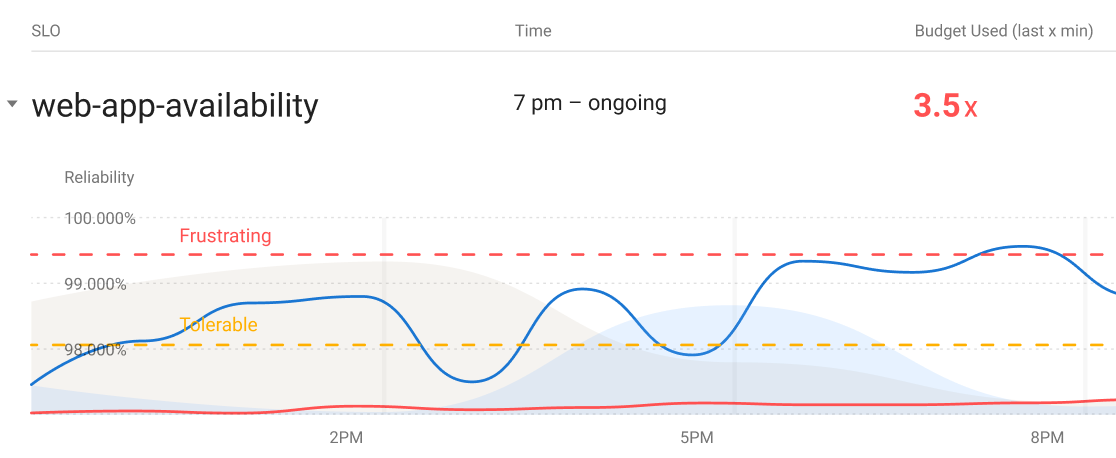
We've now crafted a service level indicator that reliably measures the availability of our data pipeline. With this and an associated SLO in hand we can set up alert rules using the idea of burn rates. If you aren't familar with alerting on SLOs, Google SRE has a great introduction to that topic. But we haven't talked much about what to do when an alert actually fires. The strength of our SLI – that it describes the symptom of a problem regardless of the cause – makes it hard to use for troubleshooting. In my next post, I'll cover ways to tackle this shortcoming.