Keep Your Applications SAAFE with Asserts

Asserts is built around the best practices laid out in the SRE Handbook and uses SAAFE for its assertion categories extending the Golden Signals described in the handbook. Traditionally Golden Signals have used the Rate, Errors and Duration (RED) or Utilisation, Saturation and Errors (USE) methodologies. The SAAFE methodology embraces and extends both of these traditional approaches.
SAAFE represents the signal categories that Asserts automatically monitors in your Prometheus metric data:
- Saturation
- Amend
- Anomaly
- Failure
- Error
The generated signals are assertions, they are to provide assistance in determining the root cause of service degradation. They are not top level signals and are not, by default, issued as alert events. The primary alerting mechanism is via Service Level Objectives, keep reading to find out more.
Asserts provides a clear overview of these signals on the insights dashboard and uses the same categorisation in the Root Cause Analysis Workbench.
The insights dashboard showing a couple of incidents in the previous 24 hours.
Signals
Asserts provides a curated library of rules that will generate assertions for all popular cloud native technologies. If required, these rules can be tweaked and additional rules added to suit your environment. To complement the rules, a curated library of Grafana dashboards is also provided.
Saturation
This category of assertion goes way back in the mists of time to the early dawn of monitoring. Saturation is a system running out of a resource, typically CPU, memory, disk space. A saturated resource often causes a degradation of performance. If a container is starved of CPU, excessive throttling, then it does not have the resources to serve requests promptly.
Amend
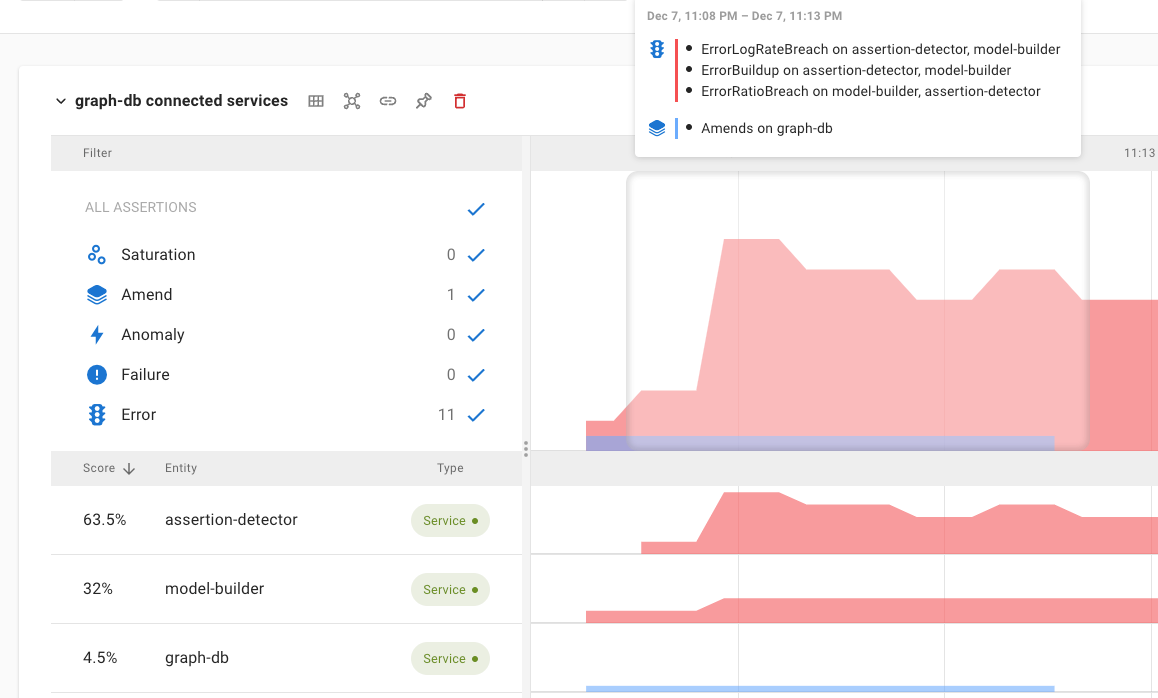
Something changed such as configuration or the deployment of a new version of a container. Changes are not a bad thing, with modern CI/CD we expect multiple changes per day. However, noting a change on the timeline provides easy correlation of change and effect. If immediately after a change there is a surge in other assertions, then it’s a good bet that the change was not a good one.
In this example the change, represented by the blue bar, is immediately followed by a number of other assertions being triggered.
Anomaly
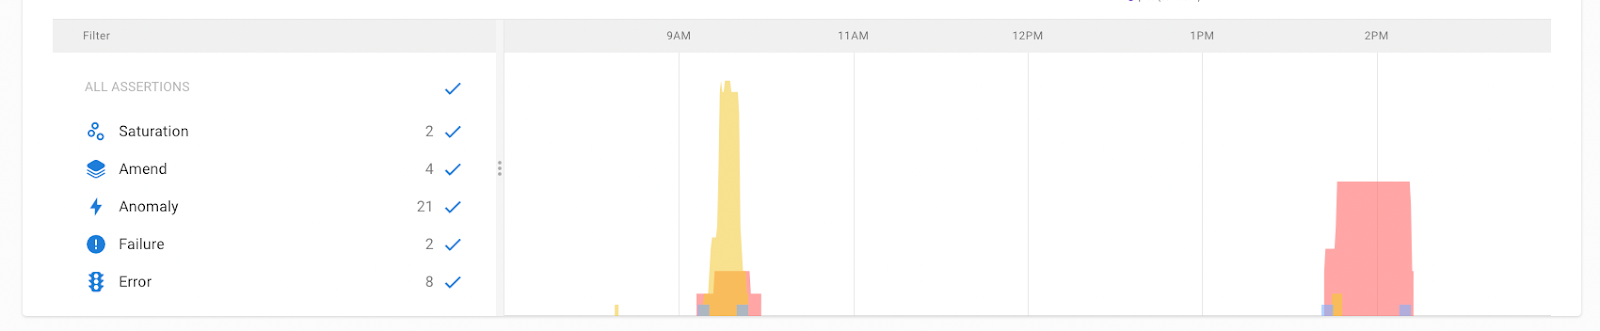
Anomaly detection is at the heart of any monitoring system. A system makes itself observable by providing data such as metrics, logs and traces. A monitoring system consumes the observability data and looks for anomalies. Asserts automatically learns what’s normal for daily and weekly patterns for key metrics and fires assertions should they deviate. Anomalies are not a bad thing, a surge in traffic on the first day of a sale is a good thing. Understanding that traffic is higher than normal assists in understanding how your services are responding to the extra load.
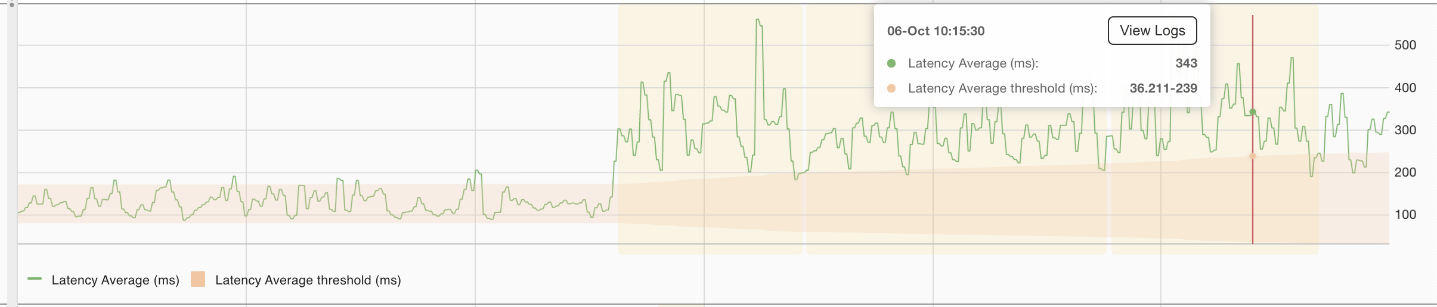
The shaded area represents abnormal average latency, which triggers an assertion.
Failure
Certain things should just never happen with specific components, for example:
- Kafa should have one and only one active controller
- Pods should not crash loop
- JVM high rate of “stop the world” garbage collection
- Redis replication broken
Typically a failure will also cause errors and anomalies and is often the root cause of an SLO breach.
Error
Unlike failures, errors are recoverable and services typically continue to function in their presence. Errors are expected and are usually logged by services. Asserts tracks the ratio of error count to success count then triggers an assertion if the ratio is out of bounds or if the ratio suddenly changes. A service may operate normally with an error ratio of 3%. If that value suddenly jumps to 15%, then an assertion is triggered.
Errors are technology specific such as HTTP 500 for requests, RabbitMQ not being able to route or dropping messages, MySQL connection drops, etc.
SLOs Are Not Just For Reporting
Asserts operationalises Service Level Objectives resulting in significantly reducing alert fatigue caused by the usual stream of false positives. SAAFE assertions are not by default sent out as alerts, they are signals to assist in determining the root cause of service degradation.
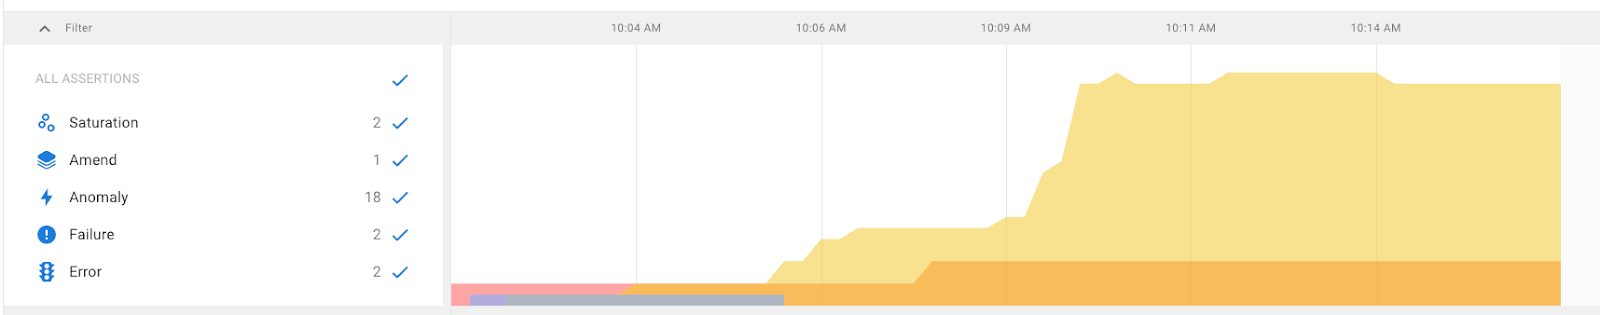
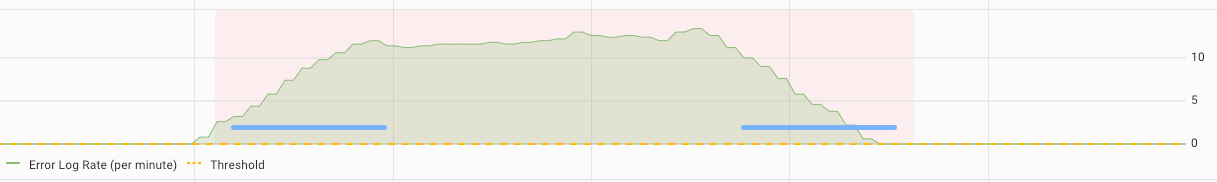
A service may currently have suboptimal configuration and would benefit from some tuning, however, it is not having an impact on the Service Level Objective. Therefore its chattering assertions are noted but not emitted as alerts, unlike many other monitoring systems that would blast your Slack channel with noise.

The above shows the catalogue service jabbering away with occasional latency and saturation assertions. Investigation shows no pattern for the latency and the saturation is due to it being tight on memory but not fatally so; certainly something that can be tuned.
Looking at the SLO that includes the catalogue service shows that it is having a negligible impact.
The latency peaks are just below the threshold for the SLO therefore it is not breached and no alert is issued.
Stay SAAFE
Quieten the chattering alerts of legacy monitoring tools by adopting Asserts SAAFE methodology and operationalising Service Level Objectives. Quickly determine the root cause of service degradation using assertion signals to guide you. See Asserts in action for yourself with the sandbox or deploy it alongside your current Prometheus instances.